

The US Census indicates that 35% of US residents are less than 25 years old. Figure 3.7
Question:
Figure 3.7
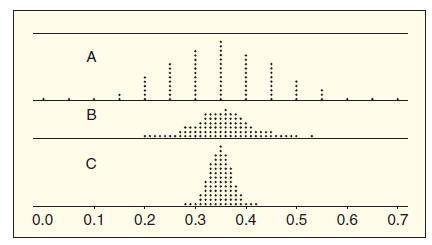 (a) Which distribution goes with which sample size?
(b) If we use a proportion p̂, based on a sample of size n = 20, to estimate the population parameter p = 0.35, would it be very surprising to get an estimate that is off by more than 0.10 (that is, the sample proportion is less than 0.25 or greater than 0.45)? How about with a sample of size n = 100? How about with a sample of size n = 500?
(c) Repeat part (b) if we ask about the sample proportion being off by just 0.05 or more.
(d) Using parts (b) and (c), comment on the effect that sample size has on the accuracy of an estimate.
The word "distribution" has several meanings in the financial world, most of them pertaining to the payment of assets from a fund, account, or individual security to an investor or beneficiary. Retirement account distributions are among the most...
Fantastic news! We've Found the answer you've been seeking!
Step by Step Answer:
a As the sample size goes up the accuracy improves which means the spread goes down We see that dist...View the full answer

Answered By
David Ngaruiya
i am a smart worker who concentrates on the content according to my clients' specifications and requirements.
7+ Reviews
19+ Question Solved
Related Book For 

Statistics, Enhanced Unlocking The Power Of Data
ISBN: 9781119308843
2nd Edition
Authors: Robin H Lock, Patti Frazer Lock, Kari Lock Morgan, Eric F Lock, Dennis F Lock
Question Posted:
