

Question: Using the sampling distribution shown in Figure 3.5(b), how likely are these sample means: Figure 3.5 b. (a) xÌ = 70 (b) xÌ = 100
Figure 3.5
b.
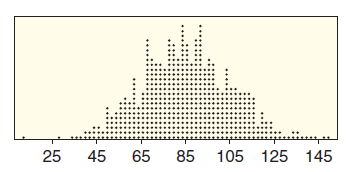
(a) xÌ… = 70
(b) xÌ… = 100
(c) xÌ… = 140
Refer to the sampling distributions given in Figure 3.5. Several possible values are given for a sample statistic. In each case, indicate whether each value is (i) reasonably likely to occur from a sample of this size, (ii) unusual but might occur occasionally, or (iii) extremely unlikely to ever occur.
25 45 65 85 105 125 145
Step by Step Solution
★★★★★
3.53 Rating (174 Votes )
There are 3 Steps involved in it
1 Expert Approved Answer
Step: 1 Unlock

a We see in the sampling distribution that a sample m... View full answer
Question Has Been Solved by an Expert!
Get step-by-step solutions from verified subject matter experts
Step: 2 Unlock
Step: 3 Unlock