

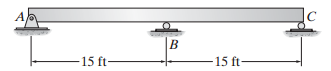
Question: Draw the influence line for the reaction at C. Plot the numerical values every 5 ft. EI is constant. B -15 ft- -15 ft-
B -15 ft- -15 ft-
Step by Step Solution
★★★★★
3.39 Rating (165 Votes )
There are 3 Steps involved in it
1 Expert Approved Answer
Step: 1 Unlock

x 0 ft 0 M 0 0 x 5 ft x 10 ft x 15 ft 15 M 15 0 x 20 ft ... View full answer
Question Has Been Solved by an Expert!
Get step-by-step solutions from verified subject matter experts
Step: 2 Unlock
Step: 3 Unlock
Document Format (2 attachments)
1589_60619c5af18d7_677176.pdf
180 KBs PDF File
1589_60619c5af18d7_677176.docx
120 KBs Word File