

The odds against the person having either A+ or O+ blood. The following circle graph shows the
Question:
The odds against the person having either A+ or O+ blood.
The following circle graph shows the percent of Americans with the various types of blood.
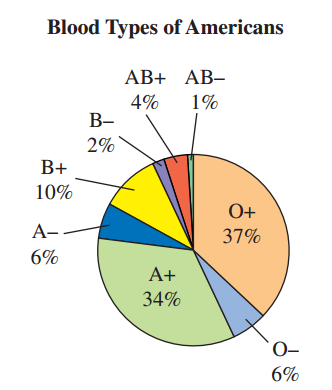
If one American is selected at random, use the graph to determine
Fantastic news! We've Found the answer you've been seeking!
Step by Step Answer:
PA or O ...View the full answer

Answered By
Gabriela Rosalía Castro
I have worked with very different types of students, from little kids to bussines men and women. I have thaught at universities, schools, but mostly in private sessions for specialized purpuses. Sometimes I tutored kids that needed help with their classes at school, some others were high school or college students that needed to prepare for an exam to study abroud. Currently I'm teaching bussiness English for people in bussiness positions that want to improve their skills, and preparing and ex-student to pass a standarized test to study in the UK.
1+ Reviews
10+ Question Solved
Related Book For 

A Survey of Mathematics with Applications
ISBN: 978-0134112107
10th edition
Authors: Allen R. Angel, Christine D. Abbott, Dennis Runde
Question Posted:
