

The odds in favor of the person having B- blood. The following circle graph shows the percent
Question:
The odds in favor of the person having B- blood.
The following circle graph shows the percent of Americans with the various types of blood.
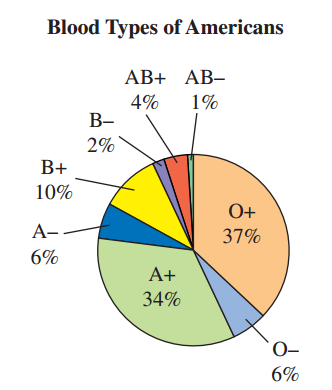
If one American is selected at random, use the graph to determine
Fantastic news! We've Found the answer you've been seeking!
Step by Step Answer:
298...View the full answer

Answered By
Utsab mitra
I have the expertise to deliver these subjects to college and higher-level students. The services would involve only solving assignments, homework help, and others.
I have experience in delivering these subjects for the last 6 years on a freelancing basis in different companies around the globe. I am CMA certified and CGMA UK. I have professional experience of 18 years in the industry involved in the manufacturing company and IT implementation experience of over 12 years.
I have delivered this help to students effortlessly, which is essential to give the students a good grade in their studies.
2+ Reviews
10+ Question Solved
Related Book For 

A Survey of Mathematics with Applications
ISBN: 978-0134112107
10th edition
Authors: Allen R. Angel, Christine D. Abbott, Dennis Runde
Question Posted:
