

Question: Using a computer simulation, verify the design in Problem 9.78(a). Plot (v_{O}) versus frequency over the range (2 leq f leq 100 mathrm{kHz}). Data From
Using a computer simulation, verify the design in Problem 9.78(a). Plot \(v_{O}\) versus frequency over the range \(2 \leq f \leq 100 \mathrm{kHz}\).
Data From Problem 9.78:-
(a) Using the results of Problem 9.77, design the high-pass active filter in Figure P9.77 such that the high-frequency voltage gain is -15 and the \(-3 \mathrm{~dB}\) frequency is \(20 \mathrm{kHz}\). The maximum resistance value is to be limited to \(350 \mathrm{k} \Omega\).
(b) Repeat part (a) such that the high-frequency gain is -25 and the \(-3 \mathrm{~dB}\) frequency is \(35 \mathrm{kHz}\). The minimum resistance value is to be limited to \(20 \mathrm{k} \Omega\).
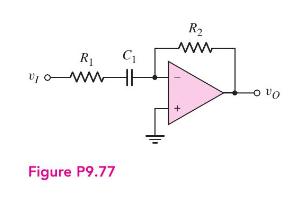
Data From Problem 9.77:-
The circuit shown in Figure P9.77 is a first-order high-pass active filter.
(a) Show that the voltage transfer function is given by \[A_{v}=\frac{-R_{2}}{R_{1}} \cdot \frac{j \omega R_{1} C_{1}}{1+j \omega R_{1} C_{1}}\]
(b) What is the voltage gain as the frequency becomes large?
(c) At what frequency is the magnitude of the gain a factor of \(\sqrt{2}\) less than the high-frequency limiting value?
R C Htwo la Figure P9.77 R ww On o
Step by Step Solution
3.42 Rating (146 Votes )
There are 3 Steps involved in it

Get step-by-step solutions from verified subject matter experts