

Question: Using a computer simulation, verify the design in Problem 9.76(b). Plot (v_{O}) versus frequency over the range (2 leq f leq 50 mathrm{kHz}). Data From
Using a computer simulation, verify the design in Problem 9.76(b). Plot \(v_{O}\) versus frequency over the range \(2 \leq f \leq 50 \mathrm{kHz}\).
Data From Problem 9.76:-
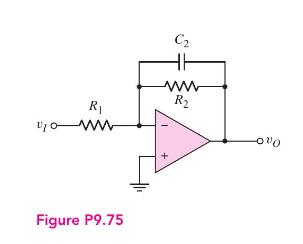
(a) Using the results of Problem 9.75, design the low-pass active filter in Figure P9.75 such that the input resistance is \(20 \mathrm{k} \Omega\), the low-frequency gain is -15 , and the \(-3 \mathrm{~dB}\) frequency is \(5 \mathrm{kHz}\).
(b) Repeat part (a) such that the input resistance is \(15 \mathrm{k} \Omega\), the low-frequency gain is -25 , and the \(-3 \mathrm{~dB}\) frequency is \(15 \mathrm{kHz}\).
Data From Problem 9.75:-
The circuit in Figure P9.75 is a first-order low-pass active filter.
(a) Show that the voltage transfer function is given by \[A_{v}=\frac{-R_{2}}{R_{1}} \cdot \frac{1}{1+j \omega R_{2} C_{2}}\]
(b) What is the voltage gain at dc \((\omega=0)\) ?
(c) At what frequency is the magnitude of the voltage gain a factor of \(\sqrt{2}\) less that the dc value? (This is the \(-3 \mathrm{~dB}\) frequency.)
R Figure P9.75 C ww R
Step by Step Solution
3.33 Rating (144 Votes )
There are 3 Steps involved in it

Get step-by-step solutions from verified subject matter experts