

Question: 1267 Consider the gain plot in Figure P1267. (a) Find a transfer function corresponding to the straight-line gain plot. Note that the magnitude of the
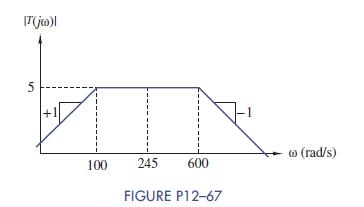
12–67 Consider the gain plot in Figure P12–67.
(a) Find a transfer function corresponding to the straight-line gain plot. Note that the magnitude of the actual frequency response must be exactly 5 at the geometric mean of the two cutoff frequencies ð245 rad=sÞ.
(b) Use MATLAB to plot the Bode magnitude of the transfer function.
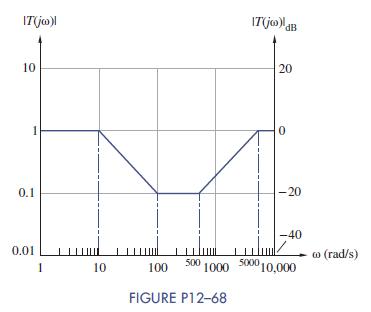
12–68 Consider the gain plot in Figure P12–68.
(a) Find the transfer function corresponding to the straightline gain plot.
(b) Use MATLAB to plot the Bode magnitude of the transfer function.
(c) Design a circuit that will realize the transfer function found in part (a).
(d) Use Multisim to verify your circuit design
IT(jw)| 5 (rad/s) 100 245 600 FIGURE P12-67
Step by Step Solution
There are 3 Steps involved in it

Get step-by-step solutions from verified subject matter experts