

Question: Consider the gain plot in Figure P1254. (a) Find a transfer function corresponding to the straightline gain plot. Note that the magnitude of the actual
Consider the gain plot in Figure P12–54.
(a) Find a transfer function corresponding to the straightline gain plot. Note that the magnitude of the actual frequency response must be exactly 5 at the geometric mean of the two cutoff frequencies (245 rad/s).
(b) Use MATLAB to plot the Bode magnitude of the transfer function.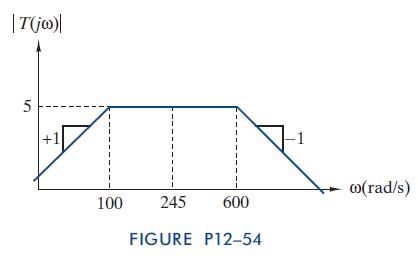
|T(jw)| 5 +1 w(rad/s) 100 245 600 FIGURE P12-54
Step by Step Solution
There are 3 Steps involved in it
1 Expert Approved Answer
Step: 1 Unlock

Question Has Been Solved by an Expert!
Get step-by-step solutions from verified subject matter experts
Step: 2 Unlock
Step: 3 Unlock