

Question: 1266 Consider the gain plot in Figure P1266. (a) Find the transfer function corresponding to the straightline gain plot. (b) Hand-draw a straight-line plot of
12–66 Consider the gain plot in Figure P12–66.
(a) Find the transfer function corresponding to the straightline gain plot.
(b) Hand-draw a straight-line plot of the phase.
(c) Use MATLAB to plot the Bode magnitude and phase of the transfer function.
(d) Compare the straight-line gain and phase with the actual responses (from MATLAB) at ω = 100 and 500 rad=s.
(e) Design a circuit that will realize the transfer function found in part (a).
(f) Use Multisim to verify your circuit design.
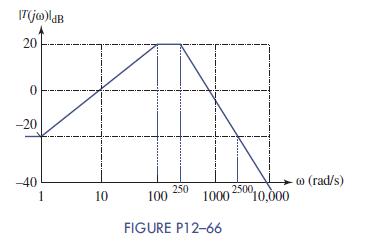
IT(jw)ldB 20 0 -20 -40 250 1 10 100 2500, 1000 10,000 FIGURE P12-66 - (rad/s)
Step by Step Solution
There are 3 Steps involved in it
1 Expert Approved Answer
Step: 1 Unlock

Question Has Been Solved by an Expert!
Get step-by-step solutions from verified subject matter experts
Step: 2 Unlock
Step: 3 Unlock