

Calculation problem: Regression lines. Mens faces have higher width-to-height ratios than womens, on average. This turns out
Question:
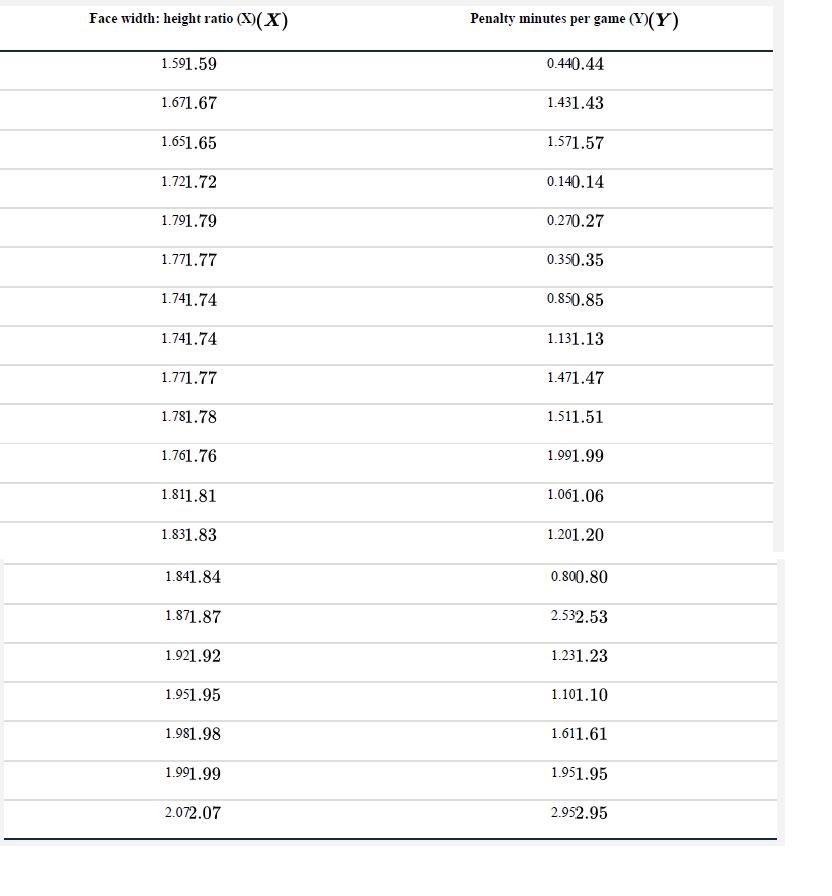
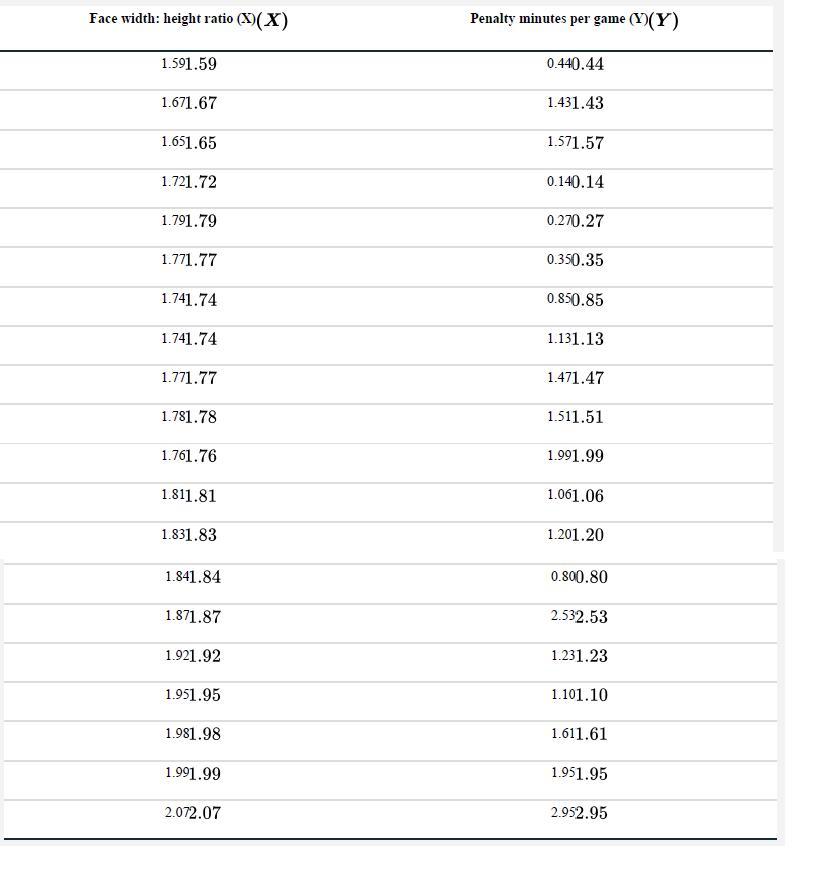
Calculation problem: Regression lines. Men’s faces have higher width-to-height ratios than women’s, on average. This turns out to reflect a difference in testosterone expression during puberty. Testosterone is also known to predict aggressive behavior. Does face shape predict aggression? To test this, Carré and McCormick (2008) compared the face width-to-height ratio of 21 university hockey players with the average number of penalty minutes awarded per game for aggressive infractions like fighting or cross-checking. Their data are below along with some partial calculations. We will calculate the equation for the line that best predicts penalty minutes from face width-to-height ratio.
a. Plot the data in a scatter plot.
b. Examine the graph. Based on this graph, do the assumptions of linear regression appear to be met?
c. Calculate the means of the two variables. (While you’re doing so, record the sum of all X-values and the sud. Calculate the sum of X2, the sum of Y2, and the sum of the product X Y .m of all Y-values.
e. Calculate the sum of products (Σi(Xi−x̄) (Yi−Y̅)) and the sum of squares (Σi(Xi−x̄)2) of the explanatory variable, face ratio.
f. How steeply does the number of penalty minutes increase per unit increase in face ratio? From the sum of products and sum of squares for face ratio, calculate the estimate b of the slope. Doublecheck that the sign of the slope matches your impression from the scatter plot.
g. Calculate the estimate of the intercept, a from the variable means and b.
h. Write the result in the form of an equation for the line. Add your line to the graph in (a).
Step by Step Answer:
a b The data seem to fit the assumptions The residuals are symmetric and dont ...View the full answer


The Analysis Of Biological Data
ISBN: 9781319226237
3rd Edition
Authors: Michael C. Whitlock, Dolph Schluter
