

Each of the following graphs illustrates an association between two variables. For each graph, identify (1) The
Question:
Each of the following graphs illustrates an association between two variables. For each graph, identify
(1) The type of graph,
(2) The explanatory and response variables, and
(3) The type of data (whether numerical or categorical) for each variable.
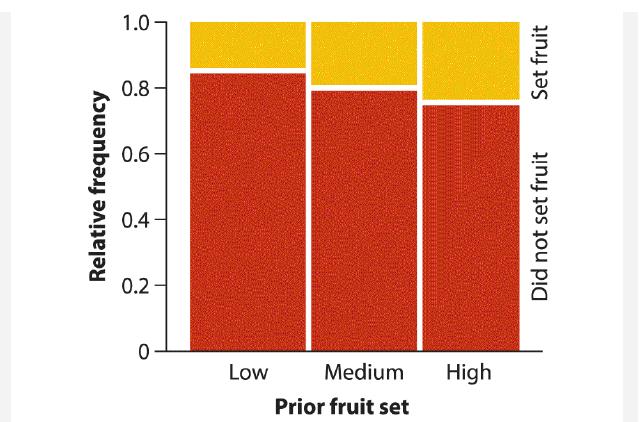
a. Observed fruiting of individual plants in a population of Campanula americana according to the number of fruits produced previously (Richardson and Stephenson 1991):
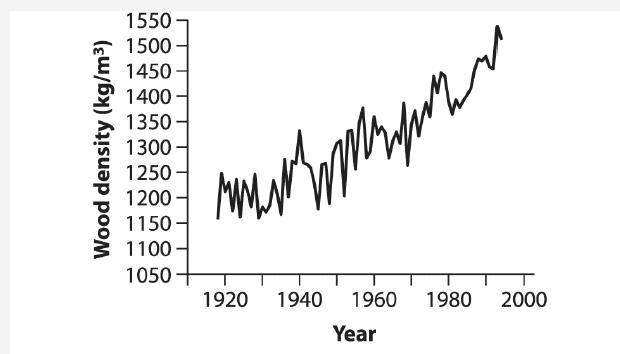
b. The maximum density of wood produced at the end of the growing season in white spruce trees in Alaska in different years (data from Barber et al. 2000):
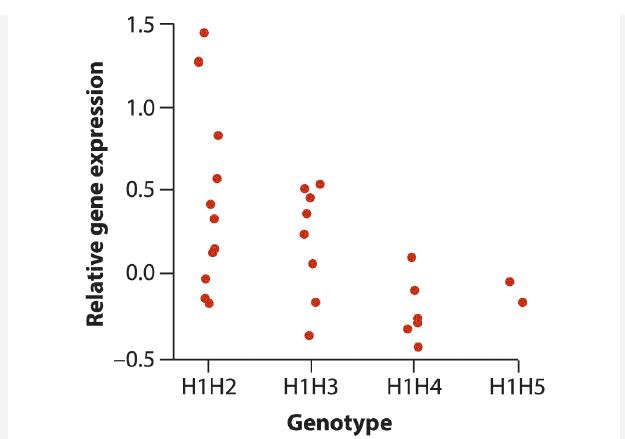
c. Relative expression levels of Neuropeptide Y (NPY), a gene whose activity correlates with anxiety and is induced by stress, in the brains of people differing in their genotypes at the locus
Step by Step Answer:
a Mosaic plot The explanatory variable is fruit set in previous years Th...View the full answer


The Analysis Of Biological Data
ISBN: 9781319226237
3rd Edition
Authors: Michael C. Whitlock, Dolph Schluter
