

The following graph is from a study of the proficiency of two groups of people on a
Question:
The following graph is from a study of the proficiency of two groups of people on a complex visual task involving “rhythmic temporal patterns similar to Morse code” (Saenz & Koch 2008). One group consisted of four auditory synesthetes—healthy adults who experienced sound as well as sight when they observed visual flashes. The other group consisted of 10 adult controls who were not synesthetes.
The study was conducted to determine if auditory synesthesia improves performance on the visual tasks. The score of each individual was measured on a scale of 0 to 100. The bars show the average score of the people in each group. (The lines protruding outward from the top edge of each bar are “standard error bars”—we’ll learn about them in Chapter 4.) The raw data are available for download at whitlockschluter3e.zoology.ubc.ca.
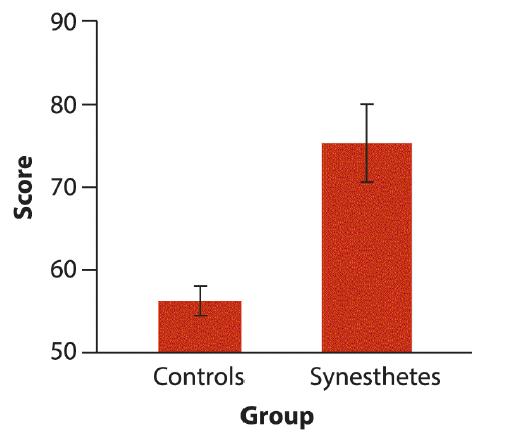
a. Describe the essential findings displayed in the figure.
b. Which two principles of good graph design are violated in this figure?
c. Computer optional: Download the data and redraw the plot, following the four principles of good graph design.
Step by Step Answer:
a The average score is higher for the synesthetes b ...View the full answer


The Analysis Of Biological Data
ISBN: 9781319226237
3rd Edition
Authors: Michael C. Whitlock, Dolph Schluter
