

Examine the figure below, which indicates the date of first occurrence of rabies in raccoons in the
Question:
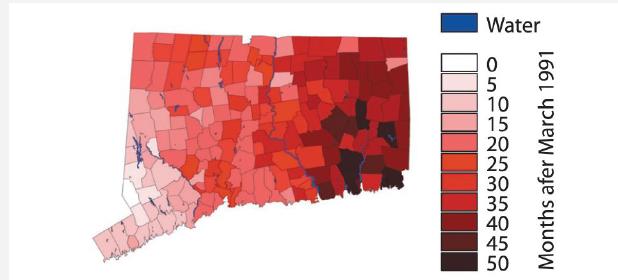
Examine the figure below, which indicates the date of first occurrence of rabies in raccoons in the townships of Connecticut, measured by the number of months following March 1, 1991.
a. Identify the type of graph shown.
b. What is the response variable?
c. What is the explanatory variable?
d. What was the direction of spread of the disease (from where to where, approximately)?
Fantastic news! We've Found the answer you've been seeking!
Step by Step Answer:
a Map b Date of first appearance of rabies ...View the full answer

Answered By
Susan Juma
I'm available and reachable 24/7. I have high experience in helping students with their assignments, proposals, and dissertations. Most importantly, I'm a professional accountant and I can handle all kinds of accounting and finance problems.
15+ Reviews
45+ Question Solved
Related Book For 

The Analysis Of Biological Data
ISBN: 9781319226237
3rd Edition
Authors: Michael C. Whitlock, Dolph Schluter
Question Posted:
