

In Example 13.1, we described the results of a study that measured the change in biomass in
Question:
In Example 13.1, we described the results of a study that measured the change in biomass in marine areas after an increase in protection. The distribution of biomass ratios (i.e., the biomass with protection divided by the biomass without protection) was highly skewed, so we performed a log transformation to overcome this problem when estimating the mean. Here we take a different approach, and we use the bootstrap to estimate the median biomass ratio. The distribution of bootstrap replicate estimates of the median are shown in the following histogram. The mean and standard deviation of this distribution are 1.484 and 0.134, respectively, and there are 1000 bootstrap replicates.
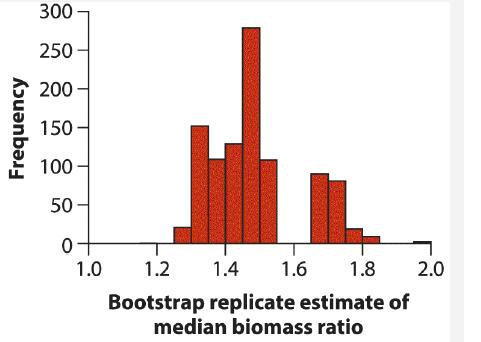
a. What does this frequency distribution estimate?
b. What is the bootstrap standard error of the median biomass ratio?
c. What is the 95% confidence interval for the median biomass ratio? Interpret the histogram to give an approximate answer.
Data from Example 13.1
Marine organisms do not enjoy anywhere near the same protection from human influence as do terrestrial species. However, marine reserves are becoming increasingly popular for biological conservation and the protection of fisheries. But are reserves effective in preserving marine wildlife?

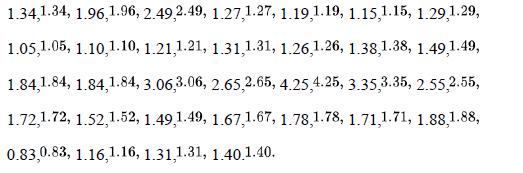
Halpern (2003) matched each of 32 marine reserves to a control location, which was either the site of the reserve before it became protected or a similar unprotected site nearby. One index of protection evaluated by the study was the “biomass ratio,” which is the total mass of all marine plants and animals per unit area of reserve divided by the same quantity in the unprotected control. This biomass ratio would equal one if protection had no effect. The biomass ratio would exceed one if the protection were beneficial, and it would be less than one if protection reduced biomass. The following list gives the biomass ratio for each of the 32 reserves:
Are marine reserves effective? In other words, does the mean biomass ratio differ from one? The null and alternative hypotheses are as follows.
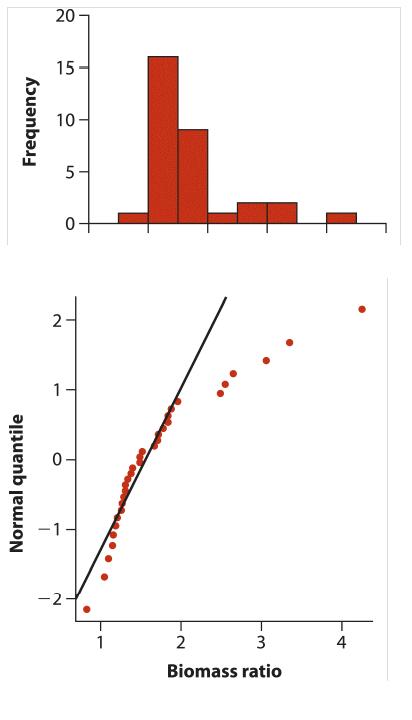
H0: The mean biomass ratio is unaffected by reserve protection (μ=1). HA: The mean biomass ratio is affected by reserve protection (μ≠1). We might be tempted to use a one-sample t-test , but this test assumes that the biomass-ratio data are drawn from a population having a normal distribution. We must start by asking whether this assumption is valid.
The best starting point is to plot the data, as in Figure 13.1-4. The histogram shows that all is not well. The frequency distribution of the biomass ratio is skewed strongly to the right. The quantile plot, moreover, shows curvature, indicating the poor fit of a normal distribution.
We’ll return to the example of these marine reserve biomass ratios in Section 13.3.
Step by Step Answer:

This question has not been answered yet.
You can Ask your question!


The Analysis Of Biological Data
ISBN: 9781319226237
3rd Edition
Authors: Michael C. Whitlock, Dolph Schluter
