

The following data are from the Cambridge Study in Delinquent Development (see Problem 22). They examine the
Question:
The following data are from the Cambridge Study in Delinquent Development (see Problem 22).
They examine the relationship between the occurrence of convictions by the end of the study and the family income of each boy when growing up. Three categories described income level: inadequate, adequate, and comfortable. The raw data are available at whitlockschluter3e.zoology.ubc.ca.
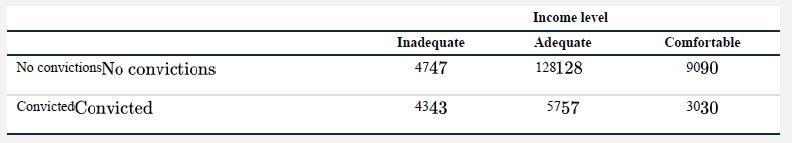
a. What type of table is this?
b. Display these same data in a mosaic plot.
c. What type of variable is “income level”? How should this affect the arrangement of groups in your mosaic plot in part (b)?
d. By viewing the table above and the graph in part (b), describe any apparent association between family income and later convictions.
e. In answering part (d), which method (the table or the graph) better revealed the association between conviction status and income level? Explain.
Data from problem 22
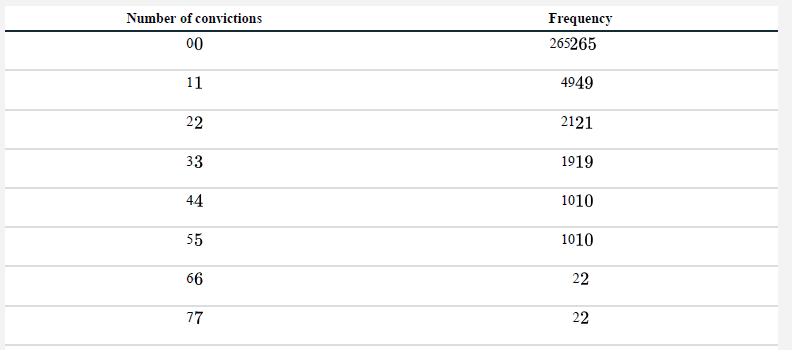
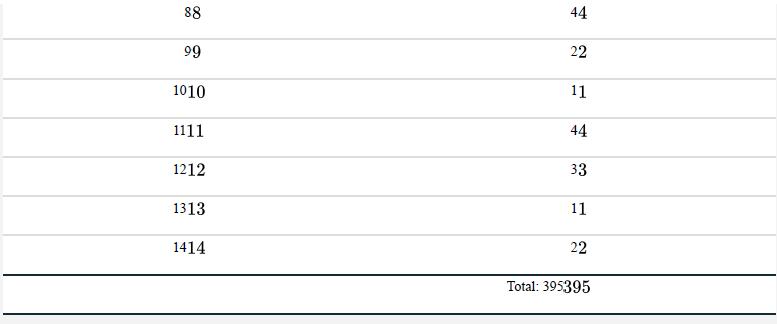
The Cambridge Study in Delinquent Development was undertaken in north London (U.K.) to investigate the links between criminal behavior in young men and the socioeconomic factors of their upbringing (Farrington 1994). A cohort of 395 boys was followed for about 20 years, starting at the age of 8 or 9. All of the boys attended six schools located near the research office. The following table shows the total number of criminal convictions by the boys between the start and end of the study. The data are available at whitlockschluter3e.zoology.ubc.ca.
Step by Step Answer:
a Contingency table b c Categorical ordered Groups should be arranged by increasing inc...View the full answer


The Analysis Of Biological Data
ISBN: 9781319226237
3rd Edition
Authors: Michael C. Whitlock, Dolph Schluter
