

The following figure is from the website of a U.S. national environmental laboratory. It displays sample mean
Question:
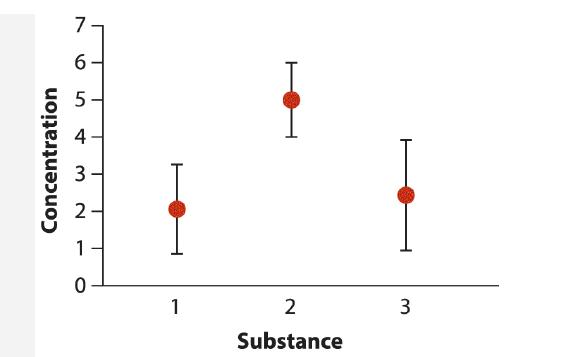
The following figure is from the website of a U.S. national environmental laboratory. It displays sample mean concentrations, with 95% confidence intervals, of three radioactive substances. The text accompanying the figure explained that “the first plotted mean is ![]() so there is a 95% chance that the actual result is between 0.9 and 3.1, a 2.5% chance it is less than 0.9, and a 2.5% chance it is greater than 3.1.” Is this a correct interpretation of a confidence interval? Explain.
so there is a 95% chance that the actual result is between 0.9 and 3.1, a 2.5% chance it is less than 0.9, and a 2.5% chance it is greater than 3.1.” Is this a correct interpretation of a confidence interval? Explain.
Fantastic news! We've Found the answer you've been seeking!
Step by Step Answer:
The interpretation of the confidence interval provided in the question is a common misunderstanding ...View the full answer

Answered By
Douglas Makokha
Unlock Academic Success with Dedicated Tutoring and Expert Writing Support!
Are you ready to excel in your academics? Look no further! As a passionate tutor, I believe that dedication and hard work are the keys to achieving outstanding results. When it comes to academics, I strive to provide nothing but the best for every student I encounter.
With a relentless thirst for knowledge, I have extensively researched numerous subjects and topics, equipping myself with a treasure trove of answers to tackle any question that comes my way. With four years of invaluable experience, I have mastered the art of unraveling even the most intricate problems. Collaborating with esteemed writers has granted me exclusive access to the trade secrets utilized by the industry's top professionals.
Allow me the pleasure of assisting you with your writing assignments. I thrive on challenges and will guide you through any obstacles you may face. Together, we will unlock your academic potential and pave the way for your success.
60+ Reviews
340+ Question Solved
Related Book For 

The Analysis Of Biological Data
ISBN: 9781319226237
3rd Edition
Authors: Michael C. Whitlock, Dolph Schluter
Question Posted:
