

The following graph was drawn using a very popular spreadsheet program in an attempt to show the
Question:
The following graph was drawn using a very popular spreadsheet program in an attempt to show the frequencies of observations in four hypothetical groups. Before reading further, estimate by eye the frequencies in each of the four groups.
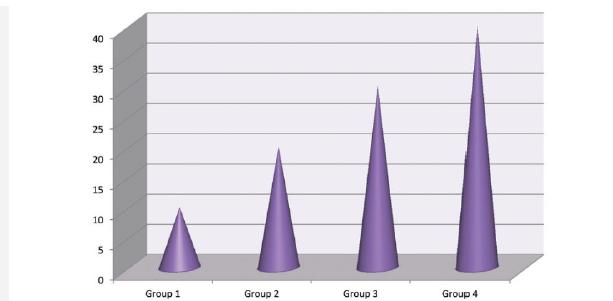
a. Identify two features of this graph that cause it to violate the principle “Make patterns in the data easy to see.”
b. Identify at least two other features of the graph that make it difficult to interpret.
c. The actual frequencies are 10, 20, 30, and 40. Draw a graph that overcomes the problems identified above.
Fantastic news! We've Found the answer you've been seeking!
Step by Step Answer:
Two features of the graph that violate the principle Make patterns in the data easy to see Bars of d...View the full answer

Answered By
Suhasnu Dey
Working as Managed Network Expert for my Specialization – Operations Management, Lean Six Sigma, Business Management, Project Management
Provide Tutorship to United States Students and Rest of the world by sharing complete Step by Step Solutions and Completely Fresh Contents (No Plagiarized Contents) for the mentioned subject
Consistently adhering to the Organizational Quality Guideline and Professional assistance and Practitioner for the mentioned specialization,
Study and Research on Various topics and Issue and Formulate Exceptional contents based on the Question asked, Achievement: Consistently obtained Proven Content feedback score from 80% to 100%, Obtained Digital Award of Excellent performance, Consistently rated high by Student and Quality Assessor
0 Reviews
10+ Question Solved
Related Book For 

The Analysis Of Biological Data
ISBN: 9781319226237
3rd Edition
Authors: Michael C. Whitlock, Dolph Schluter
Question Posted:
