

Yashin et al. (2000) compared a sample of 197 centenarians (people 100 years old or older) with
Question:
Yashin et al. (2000) compared a sample of 197 centenarians (people 100 years old or older) with a group of 465 younger people (aged between 5 and 80) to examine whether the two groups differed in the frequencies of genetic markers. As part of an attempt to estimate which genetic markers are associated with mortality, the researchers tested for the presence of “hidden heterogeneity,” intrinsic differences in mortality rate among individuals within groups. To accomplish this, they generated a likelihood model for a heterogeneity parameter, σ2, and calculated the log-likelihood for all values of σ2 between 0 and 0.8, given the data. Their methods are too complicated to describe fully here, but their results are summarized in the accompanying graph. The maximum likelihood estimate for σ2 was 0.66. The null and alternative hypotheses are as follows. H0: Heterogeneity in mortality is absent (σ2=0). HA: Heterogeneity in mortality is present (σ2≠0)
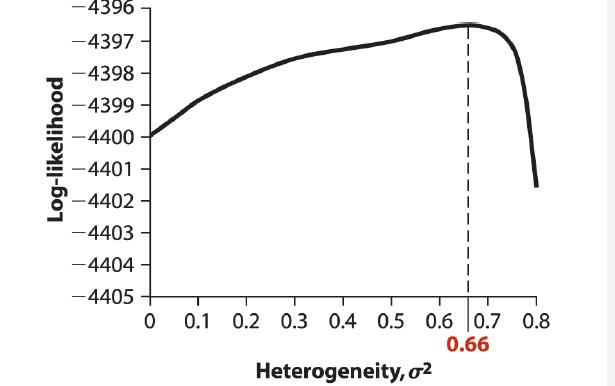
a. Using the log-likelihood curve, find the approximate value of the log-likelihood under the null hypothesis that heterogeneity is zero. Assume that the probability model used depends only on the single parameter shown.
b. With the aid of a ruler, use the log-likelihood curve to find the log-likelihood corresponding to the maximum likelihood estimate.
c. Using your results from parts (a) and (b), calculate the test statistic for a log-likelihood ratio test.
d. Under H0 , what is the approximate null distribution for the log-likelihood ratio statistic?
e. Using your results from parts (a)–(d), carry out the log-likelihood ratio test. Report your conclusion.
Step by Step Answer:
a 4400 b 43965 c G2439654400 7 ...View the full answer


The Analysis Of Biological Data
ISBN: 9781319226237
3rd Edition
Authors: Michael C. Whitlock, Dolph Schluter
