

Question: Using data from Table 2.1 (p. 34), illustrate on the following graphs real GDP and population growth since 2000 (in the manner of Figure 2.1)

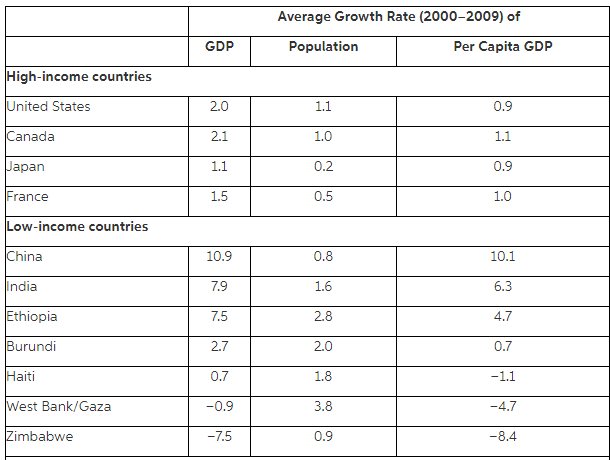
China Canada Zimbabwe 100 100 100 2000 2005 2010 2000 2005 2010 2000 2005 2010 Average Growth Rate (2000-2009) of GDP Population Per Capita GDP High-income countries United States 2.0 1.1 0.9 Canada 2.1 1.0 1.1 Japan 1.1 0.2 0.9 France 1.5 0.5 1.0 Low-income countries China 10.9 0.8 10.1 India 7.9 1.6 6.3 Ethiopia 7.5 2.8 4.7 Burundi 2.7 2.0 0.7 Haiti 0.7 1.8 -1.1 West Bank/Gaza -0.9 3.8 -4.7 Zimbabwe -7.5 0.9 -8.4
Step by Step Solution
3.37 Rating (163 Votes )
There are 3 Steps involved in it
The following graphs show the various growth rates for China Canada and Zimbabwe from 2000 t... View full answer

Get step-by-step solutions from verified subject matter experts
Document Format (2 attachments)
1459_6054778c54efc_657060.pdf
180 KBs PDF File
1459_6054778c54efc_657060.docx
120 KBs Word File