

Use EES or NIST to generate a Pv diagram for water that includes: A. Constant temperature curves
Question:
Use EES or NIST to generate a P–v diagram for water that includes:
A. Constant temperature curves at 300 K, 373 K, and 450 K that extend from compressed liquid to superheated vapor;
B. The vapor dome showing the saturated liquid and vapor conditions;
C. A linear scale for the pressure and specific volume axes.
D. Now generate the same P–v diagram but using a logarithmic scale for the pressure and specific volume axes;
E. Label the axes and isotherms. In your discussion,
F. Compare your figures with Figure 2.35 in the text.
G. From your plot, at what pressure does water at 373 K boil? (That is, become a saturated mixture.)
H. Use your plot to identify how the saturation pressure a increases with temperature.
Figure 2.35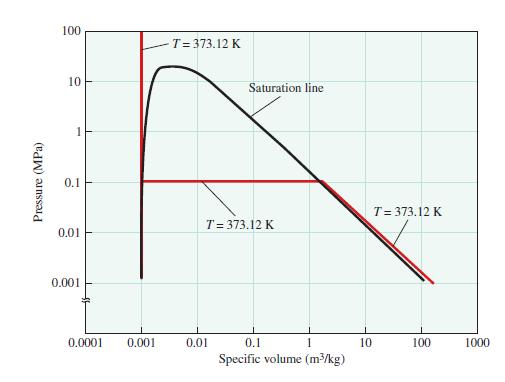
Step by Step Answer:

This question has not been answered yet.
You can Ask your question!

Thermodynamics Concepts And Applications
ISBN: 9781107179714
2nd Edition
Authors: Stephen R. Turns, Laura L. Pauley
