

Question: Break into small groups and discuss the following topics. Organize a brief outline in which you summarize the main points of your group discussion. Iris
Break into small groups and discuss the following topics. Organize a brief outline in which you summarize the main points of your group discussion.
Iris setosa is a beautiful wildflower that is found in such diverse places as Alaska, the Gulf of St. Lawrence, much of North America, and even in English meadows and parks. R. A. Fisher, with his colleague Dr. Edgar Anderson, studied these flowers extensively. Dr. Anderson described how he collected information on irises:
I have studied such irises as I could get to see, in as great detail as possible, measuring iris standard after iris standard and iris fall after iris fall, sitting squatlegged with record book and ruler in mountain meadows, in cypress swamps, on lake beaches, and in English parks. [Anderson, E., “The Irises of the Gaspé Peninsula,” Bulletin, American Iris Society, 59:2–5, 1935.]
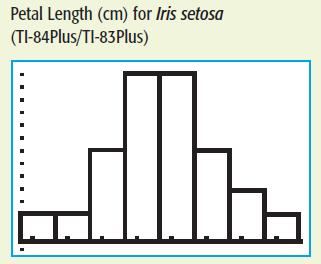
The data in Table 7-3 were collected by Dr. Anderson and were published by his friend and colleague R. A. Fisher in a paper entitled “The Use of Multiple Measurements in Taxonomic Problems” (Annals of Eugenics, part II, 179–188,1936). To find these data, visit the Brase/Brase statistics site at college.hmco.com/ pic/braseUS9e and find the link to DASL, the Carnegie Mellon University Data and Story Library. From the DASL site, look under famous data sets. Let x be a random variable representing petal length. Using a TI-84Plus/TI-83Plus calculator, it was found that the sample mean is X̅ = 1.46 centimeters (cm) and the sample standard deviation is s = 0.17 cm. Figure 7-8 shows a histogram for the given data generated on a TI-84Plus/TI-83Plus calculator.
(a) Examine the histogram for petal lengths. Would you say that the distribution is approximately mound-shaped and symmetrical? Our sample has only 50 irises; if many thousands of irises had been used, do you think the distribution would look even more like a normal curve? Let x be the petal length of Iris setosa.
Research has shown that x has an approximately normal distribution, with mean μ = 1.5 cm and standard deviation σ = 0.2 cm.
(b) Use the empirical rule with μ = 1.5 and σ = 0.2 to get an interval in which approximately 68% of the petal lengths will fall. Repeat this for 95% and 99.7%. Examine the raw data and compute the percentage of the raw data that actually falls into each of these intervals (the 68% interval, the 95% interval, and the 99.7% interval).
Compare your computed percentages with those given by the empirical rule.
(c) Compute the probability that a petal length is between 1.3 and 1.6 cm. Compute the probability that a petal length is greater than 1.6 cm.
(d) Suppose that a random sample of 30 irises is obtained. Compute the probability that the average petal length for this sample is between 1.3 and 1.6 cm. Compute the probability that the average petal length is greater than 1.6 cm.
(e) Compare your answers to parts (c) and (d). Do you notice any differences? Why would these differences occur?
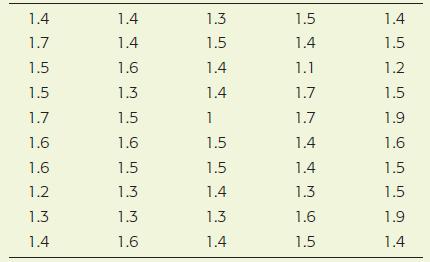
1.4 1.7 1.5 1.5 1.7 1.6 1.6 1.2 1.3 1.4 1.4 1.4 1.6 1.3 1.5 1.6 1.5 1.3 1.3 1.6 1.3 1.5 1.4 1.4 1 1.5 1.5 1.4 1.3 1.4 1.5 1.4 1.1 1.7 1.7 1.4 1.4 1.3 1.6 1.5 1.4 1.5 1.2 1.5 1.9 1.6 1.5 1.5 1.9 1.4
Step by Step Solution
3.41 Rating (160 Votes )
There are 3 Steps involved in it
a The group examined the histogram for petal lengths and concluded that the distribution appears to be approximately moundshaped and symmetrical They ... View full answer

Get step-by-step solutions from verified subject matter experts