

Question: Break into small groups and discuss the following topics. Organize a brief outline in which you summarize the main points of your group discussion. Scatter
Break into small groups and discuss the following topics. Organize a brief outline in which you summarize the main points of your group discussion. Scatter diagrams! Are they really useful? Scatter diagrams give a first impression of a data relationship and help us assess whether a linear relation provides a reasonable model for the data. In addition, we can spot influential points. A data point with an extreme x value can heavily influence the position of the least-squares line. In this project, we look at data sets with an influential point.
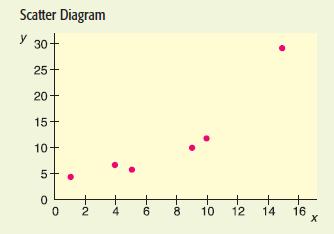
(a) Compute r and b, the slope of the least-squares line. Find the equation of the leastsquares line, and sketch the line on the scatter diagram.
(b) Notice the point boxed in blue in Figure 10-23. Does it seem to lie away from the linear pattern determined by the other points? The coordinates of that point are (15, 4). Is it an influential point? Remove that point from the model and recompute r, b, and the equation of the least-squares line. Sketch this least-squares line on the diagram. How does the removal of the influential point affect the values of r and b and the position of the least-squares line?
(c) Consider the scatter diagram of Figure 10-24. Is there an influential point? If you remove the influential point, will the slope of the new least-squares line be larger or smaller than the slope of the line from the original data? Will the correlation coefficient be larger or smaller?
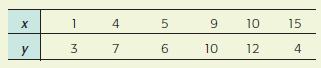
X y 1 3 4 7 5 6 9 10 10 12 15 4
Step by Step Solution
3.40 Rating (153 Votes )
There are 3 Steps involved in it
Lets work through the problem stepbystep a Compute r and b the slope of the leastsquares line Step 1 ... View full answer

Get step-by-step solutions from verified subject matter experts