

Question: The density values in Table 12.1 are listed in increasing order. A chemistry student notices that the first four chemical elements that are included are
(a) See whether there is a simple relationship between density and atomic mass by plotting a graph of density (in g/cm3) versus atomic mass for all eight elements in that table. (See Appendix D for their atomic masses in grams per mole.)
(b) Can you draw a straight line or simple curve through the points to find a €œsimple€ relationship?
(c) Explain why €œMore massive atoms result in more dense solids€ does not tell the whole story.
Table 12.1
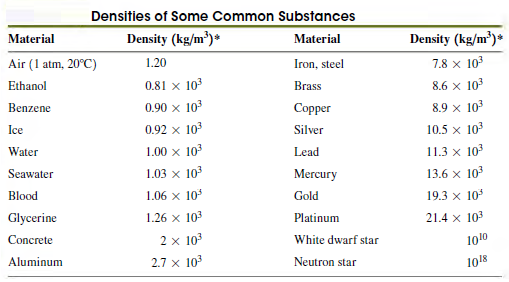
Densities of Some Common Substances Density (kg/m)* Density (kg/m)* Material Material 7.8 x 10³ 1.20 Air (1 atm, 20C) Iron, steel 0.81 x 10 8.6 x 10³ Ethanol Brass 0.90 x 10³ 8.9 x 10³ Benzene Copper 0.92 x 10³ 10.5 x 10³ Ice Silver 1.00 x 10³ Water Lead 11.3 x 10 1.03 x 10 13.6 x 10³ Seawater Mercury 1.06 x 10 19.3 x 10 Blood Gold Glycerine 1.26 x 10³ 21.4 x 10³ Platinum 2 x 10³ White dwarf star Concrete 1010 Aluminum 2.7 x 10 Neutron star 1018
Step by Step Solution
3.37 Rating (169 Votes )
There are 3 Steps involved in it
IDENTIFY and SET UP We are given the densities of elements in the table an... View full answer

Get step-by-step solutions from verified subject matter experts