

Question: Suppose AnderSet Laboratories takes some additional samples of the same size, yielding the following results. Plot these samples on the control charts and circle any
Suppose AnderSet Laboratories takes some additional samples of the same size, yielding the following results. Plot these samples on the control charts and circle any observations that appear to be out of control.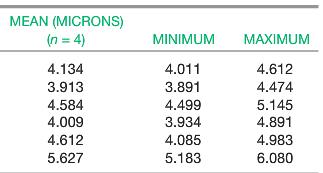
MEAN (MICRONS) (n = 4) MINIMUM MAXIMUM 4.134 4.011 4.612 3.913 3.891 4.474 4.499 3.934 4.584 5.145 4.009 4.891 4.612 4.085 4.983 5.627 5.183 6.080
Step by Step Solution
3.42 Rating (174 Votes )
There are 3 Steps involved in it
tr msoheightsourceauto col msowidthsourceauto br msodataplacementsamecell style0 msonumberformatGeneral textaligngeneral verticalalignbottom whitespac... View full answer

Get step-by-step solutions from verified subject matter experts
Document Format (1 attachment)
436-B-M-L-S-C-M (2628).xlsx
300 KBs Excel File