

Question: The bottom graph in Figure 13.1 shows the actual performance of the Standard and Poor?s 500 Index for a five-year period. Two financial managers, Alpha
The bottom graph in Figure 13.1 shows the actual performance of the Standard and Poor?s 500 Index for a five-year period. Two financial managers, Alpha and Beta, are contemplating this chart. Each manager?s company needs to issue new shares of common stock sometime in the next year.
Alpha: My company?s going to issue right away. The stock market cycle has obviously topped out, and the next move is almost surely down. Better to issue now and get a decent price for the shares.
Beta: You?re too nervous; we?re waiting. It?s true that the market?s been going nowhere for the past year or so, but the figure clearly shows a basic upward trend. The market?s on the way up to a new plateau. What would you say to Alpha and Beta?
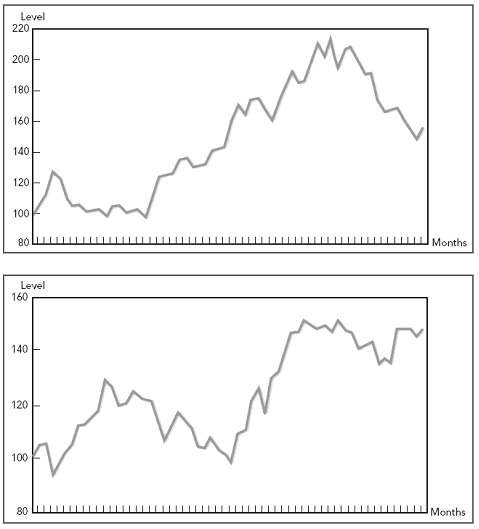
Level 220 200 180 160- 140 120E 100 80 Months Level 160 140 120 100 80 Months
Step by Step Solution
3.44 Rating (176 Votes )
There are 3 Steps involved in it
They are both under the illusion that markets are predicta... View full answer

Get step-by-step solutions from verified subject matter experts
Document Format (1 attachment)
35-B-C-F-F-D (10).docx
120 KBs Word File