

Question: The data from Exercise are reproduced in the table below. The table shows last years percentage increase in value for each of the 15 stocks
The data from Exercise are reproduced in the table below. The table shows last year’s percentage increase in value for each of the 15 stocks in your investment portfolio:
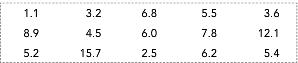
Draw the box plot.
614 582 576 805 257 345 192
Step by Step Solution
★★★★★
3.44 Rating (180 Votes )
There are 3 Steps involved in it
1 Expert Approved Answer
Step: 1 Unlock

The ordered list is 1 2 3 4 5 6 7 8 9 10 11 12 13 14 15 11 25 32 36 45 52 54 55 60 62 68 78 89 1... View full answer
Question Has Been Solved by an Expert!
Get step-by-step solutions from verified subject matter experts
Step: 2 Unlock
Step: 3 Unlock
Document Format (1 attachment)
486-M-S-S-I (1170).docx
120 KBs Word File