

The distribution of the monthly household incomes of a random sample of households in a city is
Question:
The distribution of the monthly household incomes of a random sample of households in a city is shown in the pie chart. Use $10,999.50 as the midpoint for “$10,000 or more.”
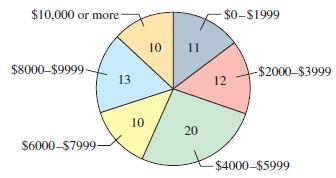
Make a frequency distribution for the data. Then use the table to estimate the sample mean and the sample standard deviation of the data set.
DistributionThe word "distribution" has several meanings in the financial world, most of them pertaining to the payment of assets from a fund, account, or individual security to an investor or beneficiary. Retirement account distributions are among the most...
Fantastic news! We've Found the answer you've been seeking!
Step by Step Answer:
Class 01999 20003999 40005999 60007999 80009999 10000 Midpoint x 9995 29995 49995 69995 89995 ...View the full answer

Answered By
Muhammad adeel
I am a professional Process/Mechanical engineer having a vast 7 years experience in process industry as well as in academic studies as a instructor. Also equipped with Nebosh IGC and lead auditor (certified).
Having worked at top notch engineering firms, i possess abilities such as designing process equipment, maintaining data sheets, working on projects, technical biddings, designing PFD and PID's etc.
Having worked as an instructor in different engineering institutes and have been involved in different engineering resrearch projects such as refinery equipment designing, thermodynamics, fluid dynamics, chemistry, rotary equipment etc
I can assure a good job within your budget and time deadline
52+ Reviews
60+ Question Solved
Related Book For 

Elementary Statistics Picturing The World
ISBN: 9780321911216
6th Edition
Authors: Ron Larson, Betsy Farber
Question Posted:
