

The distribution of the numbers of hours that a random sample of college students study per week
Question:
The distribution of the numbers of hours that a random sample of college students study per week is shown in the pie chart. Use 32 as the midpoint for “30+ hours.”
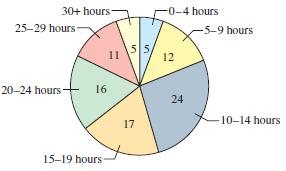
Make a frequency distribution for the data. Then use the table to estimate the sample mean and the sample standard deviation of the data set.
DistributionThe word "distribution" has several meanings in the financial world, most of them pertaining to the payment of assets from a fund, account, or individual security to an investor or beneficiary. Retirement account distributions are among the most...
Fantastic news! We've Found the answer you've been seeking!
Step by Step Answer:
Class 04 59 1014 1519 2024 2529 30 Midpoint x 2 x x fn 148090 164 7 1...View the full answer

Answered By
Bhartendu Goyal
Professional, Experienced, and Expert tutor who will provide speedy and to-the-point solutions. I have been teaching students for 5 years now in different subjects and it's truly been one of the most rewarding experiences of my life. I have also done one-to-one tutoring with 100+ students and help them achieve great subject knowledge. I have expertise in computer subjects like C++, C, Java, and Python programming and other computer Science related fields. Many of my student's parents message me that your lessons improved their children's grades and this is the best only thing you want as a tea...
2+ Reviews
10+ Question Solved
Related Book For 

Elementary Statistics Picturing The World
ISBN: 9780321911216
6th Edition
Authors: Ron Larson, Betsy Farber
Question Posted:
