

Question: The following data show the average prices for flat panel televisions in the United States over a six quarter period. a. Forecast the average price
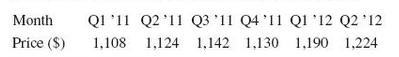
The following data show the average prices for flat panel televisions in the United States over a six quarter period.
a. Forecast the average price of a flat panel TV in the third quarter of 2012 using a two period simple moving average.
b. Calculate the MAD for the forecast in part a.
c. Forecast the average price of a flat panel TV in the third quarter of 2012 using a three period simple moving average.
d. Calculate the MAD for the forecast in part b.
e. Which forecast would you choose?
Month Q '1 Q2 1 Q3 ' Q4 Q 12 Q2 12 Price ( .108 1124 1,142 1.130 1.190 1224
Step by Step Solution
3.33 Rating (159 Votes )
There are 3 Steps involved in it
a b c d e The forecast using 2period simp... View full answer

Get step-by-step solutions from verified subject matter experts
Document Format (1 attachment)
483-M-S-F (238).docx
120 KBs Word File