

The following table shows the selling price of a random sample of residential homes, in thousands of
Question:
The following table shows the selling price of a random sample of residential homes, in thousands of dollars, at three beach communities in New Jersey. The homes are categorized by the real estate firm that is listing the home. These data can also be found in the Excel file beach.xlsx.
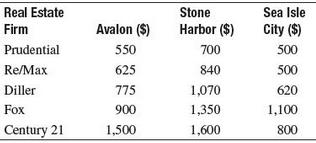
a. Using α = 0.05 and the real estate firm as a blocking factor, test to see if a difference exists in the average selling prices of homes in the three communities.
b. If warranted, determine which pairs of communities are different using α = 0.05.
c. Verify your results with Excel or PHStat.
d. Was the blocking factor effective? Why or why not?
Fantastic news! We've Found the answer you've been seeking!
Step by Step Answer:
a b There is enough evidence to conclude that the average price ...View the full answer

Answered By
Ashish Bhalla
I have 12 years work experience as Professor for Accounting, Finance and Business related subjects also working as Online Tutor from last 8 years with highly decentralized organizations. I had obtained a B.Com, M.Com, MBA (Finance & Marketing). My research interest areas are Banking Problem & Investment Management. I am highly articulate and effective communicator with excellent team-building and interpersonal skills; work well with individuals at all levels.
17+ Reviews
46+ Question Solved
Related Book For 

Question Posted:
