

Question: The frequency bar chart shows last months delivery times for packages shipped through National Express by customers who used Nationals three-day delivery time option. a.
The frequency bar chart shows last month’s delivery times for packages shipped through National Express by customers who used National’s three-day delivery time option.
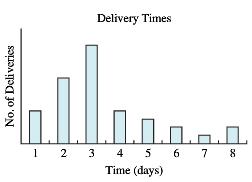
a. In one or two sentences, summarize the information that the chart is providing.
b. Show the approximate location of the mean, median and mode for the delivery time distribution. (Don’t make any detailed calculations. Just give an “educated” estimate.)
c. The MAD for the distribution looks to be approximately
i) 1.5
ii) 5.5
iii) 8.5
iv) 15
d. The standard deviation for the distribution looks to be approximately
i) 1
ii) 2
iii) 8
iv) 12
Delivery Times Time (days)
Step by Step Solution
3.42 Rating (165 Votes )
There are 3 Steps involved in it
a Clearly the company isnt meeting the 3day standard for a significant number o... View full answer

Get step-by-step solutions from verified subject matter experts
Document Format (1 attachment)
486-M-S-D-A (2425).docx
120 KBs Word File