

Question: A10-task aptitude test was given to 300 recent job applicants at Detroit Fabrication Industries. The number of successfully completed tasks was recorded for each applicant.
A10-task aptitude test was given to 300 recent job applicants at Detroit Fabrication Industries. The number of successfully completed tasks was recorded for each applicant. The bar chart below summarizes results:
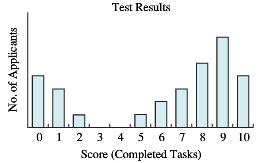
a. In one or two sentences, summarize the information that the chart is providing.
b. Show the approximate location of the mean, median and mode for the test score distribution. Don’t make any detailed calculations. Just give an “educated” estimate.
c. The MAD for the distribution looks to be approximately
i) 1
ii) 3
iii) 7
iv) 10
d. The standard deviation for the distribution looks to be approximately
i) 0
ii) 4
iii) 10
iv) 16
Test Results 0 1 2 3 4 5 678 9 10 Score (Completed Tasks)
Step by Step Solution
3.48 Rating (174 Votes )
There are 3 Steps involved in it
a The chart shows two distinct groups of applicants one that performed rather poorly on the test and ... View full answer

Get step-by-step solutions from verified subject matter experts
Document Format (1 attachment)
486-M-S-D-A (2424).docx
120 KBs Word File