

Question: The table below gives experimental results for a measurement of the period of motion T of an object of mass m suspended on a spring
The table below gives experimental results for a measurement of the period of motion T of an object of mass m suspended on a spring versus the mass of the object. These data are consistent with a simple equation expressing T as a function of m of the form T = Cmn, where C and n are constants and n is not necessarily an integer.
(a) Find n and C. (There are several ways to do this. One is to guess the value of n and check by plotting T versus mn on graph paper. If your guess is right, the plot will be a straight line. Another is to plot log T versus log m. The slope of the straight line on this plot is n.)
(b) Which data points deviate the most from a straight-line plot of T versus mn?
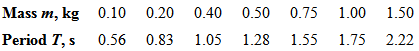
Mass m, kg 0.10 0.20 0.40 0.50 0.75 1.00 1.50 0.56 0.83 1.05 1.28 1.55 1.75 2.22 Period T, s
Step by Step Solution
3.28 Rating (169 Votes )
There are 3 Steps involved in it
a We will use a judicious guessing procedure Note tha... View full answer

Get step-by-step solutions from verified subject matter experts
Document Format (1 attachment)
10-P-M-M (254).docx
120 KBs Word File