

Question: The waveform shown in figure demonstrates what is called the duty cycle; that is, D illustrates the fraction of the total period that is occupied
The waveform shown in figure demonstrates what is called the duty cycle; that is, D illustrates the fraction of the total period that is occupied by the pulse. Determine the average value of thiswaveform.
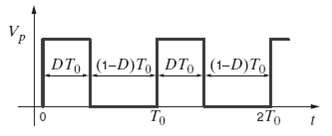
Vp DT. (1-D)T, DT. (1-D)T 2To To
Step by Step Solution
★★★★★
3.36 Rating (159 Votes )
There are 3 Steps involved in it
1 Expert Approved Answer
Step: 1 Unlock

ao ao ao ao t... View full answer
Question Has Been Solved by an Expert!
Get step-by-step solutions from verified subject matter experts
Step: 2 Unlock
Step: 3 Unlock
Document Format (1 attachment)
27-E-E-C-A (2004).docx
120 KBs Word File