

Question: Two mass spectra are shown in figure. One spectrum is that of 2-methyl-2-pentene; the other is of 2-hexene. Which is whichexplain? (a) 60 40 20
Two mass spectra are shown in figure. One spectrum is that of 2-methyl-2-pentene; the other is of 2-hexene. Which is whichexplain?
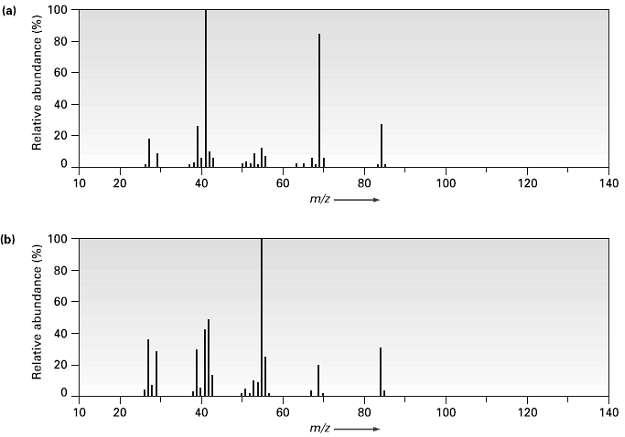
(a) 60 40 20 0. 20 60 80 120 140 10 40 100 m/z (b) 100 80 60 - 10 20 40 60 80 100 120 140 m/z Relative abundance (%) Relative abundance (%)
Step by Step Solution
★★★★★
3.47 Rating (167 Votes )
There are 3 Steps involved in it
1 Expert Approved Answer
Step: 1 Unlock

CH3CHCHC CH3 CH3 2Methyl2pentene CH3 CH3CHCHCHCHCH3 2Hexene CHCHC CHCH... View full answer
Question Has Been Solved by an Expert!
Get step-by-step solutions from verified subject matter experts
Step: 2 Unlock
Step: 3 Unlock
Document Format (1 attachment)
22-C-O-S (127).docx
120 KBs Word File