

Question: The following dataset was considered in Quality Engineering [Analytic Examination of Variance Components (19941995, Vol. 7(2)]. A quality characteristic for cement mortar briquettes was monitored.
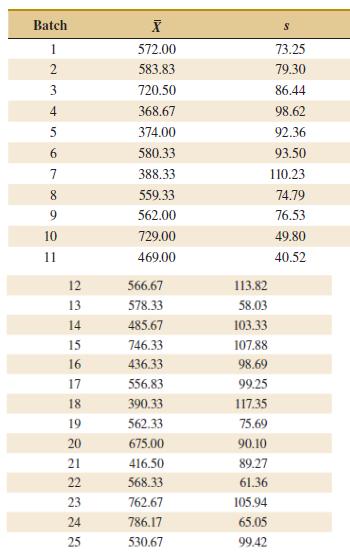
The following dataset was considered in Quality Engineering [€œAnalytic Examination of Variance Components€ (1994€“1995, Vol. 7(2)]. A quality characteristic for cement mortar briquettes was monitored. Samples of size n = 6 were taken from the process, and 25 samples from the process are shown in the following table:
(a) Using all the data, calculate trial control limits for X and S charts. Is the process in control?
(b) Suppose that the specifications are at 580 ± 250. What statements can you make about process capability? Compute estimates of the appropriate process capability ratios.
(c) To make this process a €œ6-sigma process,€ the variance σ2 would have to be decreased such that PCRk = 2.0. What should this new variance value be?
(d) Suppose the mean shifts to 600. What is the probability that this shift is detected on the next sample? What is the ARL after the shift?
Batch 1 572.00 73.25 2 583.83 79.30 3 720.50 86.44 368.67 4 98.62 5 374.00 92.36 93.50 580.33 388.33 110.23 559.33 8. 74.79 9. 562.00 76.53 10 729.00 49.80 11 469.00 40.52
Step by Step Solution
3.41 Rating (173 Votes )
There are 3 Steps involved in it
a Trial control limits S chart UCL 1702482 CL 864208 LCL 259342 X bar chart UCL 6700045 CL 558766 LC... View full answer

Get step-by-step solutions from verified subject matter experts