

Question: Zoom-frequency analysis consider the system in figure(a) (a) Sketch the spectrum of the signal y(n) = y R (n) + jy l (n) if the
Zoom-frequency analysis consider the system in figure(a)
(a) Sketch the spectrum of the signal y(n) = yR(n) + jyl(n) if the input signal x(n) has the spectrum shown in figure(b).
(b) Suppose that we are interested in the analysis of the frequencies in the band f0 ? f ? f0 + ?f,?where f0 = ?/6 and f0 = ?/3. Determine the cutoff of a lowpass filter and the decimation factor D required to retain the information contained in this band of frequencies.
(c) Assume that, where p = 40 and fk = k/p, k = 0, 1, . . . ., p ? 1. Compute and plot the 1024-point DFT of x(n).
(d) Repeat part (b) for the signal x(n) given in part (c) by using an appropriately designed lowpass linear phase FIR filter to determine the decimated signal s(n) = sR(n) + jsI(n).
(e) Compute the 1024-point DFT of s(n) and investigate to see if you have obtained the expected results.
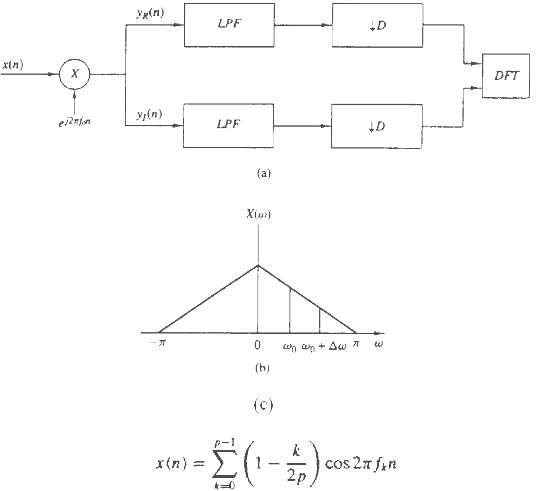
Va(n) LPF x(n) DFT y(n) eilain LPF (a) Xiu:) (b) (c) p-1 cos 2n fin 2p x(n) =
Step by Step Solution
3.36 Rating (168 Votes )
There are 3 Steps involved in it
a See the figure below b Bandwidth 3 Cut off freq 2 Sampling fr... View full answer

Get step-by-step solutions from verified subject matter experts
Document Format (1 attachment)
31-E-T-E-D-S-P (927).docx
120 KBs Word File