

Question: A Gallup poll conducted in 2011 asked respondents why they would not consider buying a hybrid car for their next purchase. The results are shown
A Gallup poll conducted in 2011 asked respondents why they would not consider buying a hybrid car for their next purchase. The results are shown in the following table. Suppose Toyota would like to confirm these results with its own survey, so the company asked 300 people the same question. The results of Toyota’s survey are also shown in the following table:
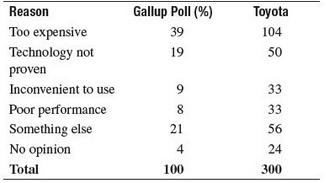
a. Using α = 0.05, determine if the observed frequencies in the Toyota survey are consistent with the results from the Gallup poll.
b. Determine the p-value using Excel and interpret its meaning.
Gallup Poll(96) 39 19 Toyota 104 50 Reason Too expensive Technology not proven Inconvenient to use Poor performance Something else No opinion Total 21 4 100 56 24 300
Step by Step Solution
3.55 Rating (155 Votes )
There are 3 Steps involved in it
a H 0 A set of observed frequencies of the reasons not buying a hybrid car in Toyota surv... View full answer

Get step-by-step solutions from verified subject matter experts
Document Format (1 attachment)
483-M-S-C-S-T (275).docx
120 KBs Word File