

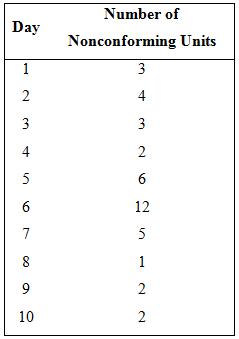
Question: Based on the data in Table 6E.6 if an np chart is to be established, what would you recommend as the center line and control
Based on the data in Table 6E.6 if an np chart is to be established, what would you recommend as the center line and control limits? Assume that n = 500.
%::
Step by Step Solution
★★★★★
3.36 Rating (152 Votes )
There are 3 Steps involved in it
1 Expert Approved Answer
Step: 1 Unlock

MTB Stat Control Charts Attributes Charts NP Test ... View full answer
Question Has Been Solved by an Expert!
Get step-by-step solutions from verified subject matter experts
Step: 2 Unlock
Step: 3 Unlock
Document Format (1 attachment)
552-M-S-Q-C-B-S (387).docx
120 KBs Word File