

Question: Consider the blending system shown in Figure. A feedback control system is used to reduce the effect of disturbances in feed composition, x 1 ,
Consider the blending system shown in Figure. A feedback control system is used to reduce the effect of disturbances in feed composition, x1, n the controlled variable, product composition, x. Inlet flow rate, w2, can be manipulated. Do the following:
(a) Draw a block diagram of the feedback control system.
(b) Using the information shown below, derive a transfer function for each block.
(c) Simulate the closed-loop response for the given PI controller settings and a step disturbance of + 0.2 in x1.
(d) Repeat part (c) for a set-point change of – 0.1. Attempt to obtain belier closed-Loop responses by tuning the P1 controller. Which controller settings give the best results?
(e) Attempt to obtain improved control by adding derivative action to your best Pt controller of part (d). Try several values of derivative time, TD. Which one gives the best results?
(f) Suppose that the sampling line to (he composition analyzer becomes partially plugged so that the measurement time delay Is now three minutes. Using your best controller settings of part (d), simulate the closed-loop response for the same set-point change and the new time-delay value. Explain your new simulation results. Does the larger time delay have a major effect on con- trot system performance?
Note: Your solution should include labeled plots for your best responses for parts (c) through (1) and a tabulation of the controller settings.
Process Information
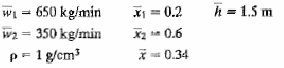
The pilot-scale blending tank has an internal diameter of 2 m and a height of 3 m. Inlet flow rate w1 and inlet composition x2 ate constant. The nominal steady-state operating conditions are as follows:
The overflow line maintains a constant liquid volume in the tank.
Instrumentation: The range for all of the electronic signals is 4 to 20mA.
Current-to-pressure transducer: The 1/P transducer acts as a linear device with negligible dynamics. The output signal changes from 3 to 15 psi when the input signal changes full-scale from 4 to 20mA.
Control valve: The behavior of the control valve can be approximated by a first-order transfer function with a time constant of 5 a (i.e., 0.0833 min). A 1.2-psi change in the signal to the control valve produces a 300 kg/min change in w2.
Composition measurement: The zero and span of the coin- position transmitter for the exit composition are 0 and 0.50 (mass fraction), respectively. A one-minute time delay is associated with the measurement.
Feedback controller: Initially, consider a standard PT controller tuned using the IMC relations in Table 12.1. Justify your choice of τc.
-2.PNG)
WL = 650 kg/min w2 = 350 kg/min p=1 g/cm h = 1.5 m X1 = 0.2 X2 a 0.6 *= 0.34 %3D
Step by Step Solution
3.37 Rating (166 Votes )
There are 3 Steps involved in it
a b c By using Simulink d By using Simulink The recommended valu... View full answer

Get step-by-step solutions from verified subject matter experts
Document Format (1 attachment)
38-E-C-E-P-C (185).docx
120 KBs Word File