

Question: Construct a relative frequency histogram for the data set using seven classes. Use the data set shown in the table at the left, which represents
Construct a relative frequency histogram for the data set using seven classes.
Use the data set shown in the table at the left, which represents the actual liquid volumes (in ounces) in 25 twelve-ounce cans.
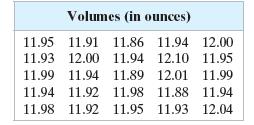
Volumes (in ounces) 11.95 11.91 11.86 11.94 12.00 11.93 12.00 11.94 12.10 11.95 11.99 11.94 11.89 12.01 11.99 11.94 11.92 11.98 11.88 11.98 11.92 11.95 11.93 11.94 12.04
Step by Step Solution
★★★★★
3.42 Rating (158 Votes )
There are 3 Steps involved in it
1 Expert Approved Answer
Step: 1 Unlock

Question Has Been Solved by an Expert!
Get step-by-step solutions from verified subject matter experts
Step: 2 Unlock
Step: 3 Unlock