

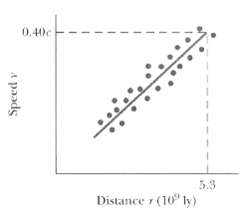
Figure is a hypothetical plot of the recessional speeds y of galaxies against their distance r from
Question:
Figure is a hypothetical plot of the recessional speeds y of galaxies against their distance r from us; the best-fit straight line through the data points is shown. From this plot determine the age of the universe, assuming that Hubble's law holds and that Hubble's constant has had the same value throughout the expansion of the universe.
Fantastic news! We've Found the answer you've been seeking!
Step by Step Answer:
Assuming the line passes ...View the full answer

Answered By
Ali Khawaja
my expertise are as follows: financial accounting : - journal entries - financial statements including balance sheet, profit & loss account, cash flow statement & statement of changes in equity -consolidated statement of financial position. -ratio analysis -depreciation methods -accounting concepts -understanding and application of all international financial reporting standards (ifrs) -international accounting standards (ias) -etc business analysis : -business strategy -strategic choices -business processes -e-business -e-marketing -project management -finance -hrm financial management : -project appraisal -capital budgeting -net present value (npv) -internal rate of return (irr) -net present value(npv) -payback period -strategic position -strategic choices -information technology -project management -finance -human resource management auditing: -internal audit -external audit -substantive procedures -analytic procedures -designing and assessment of internal controls -developing the flow charts & data flow diagrams -audit reports -engagement letter -materiality economics: -micro -macro -game theory -econometric -mathematical application in economics -empirical macroeconomics -international trade -international political economy -monetary theory and policy -public economics ,business law, and all regarding commerce
1+ Reviews
10+ Question Solved
Related Book For 
Fundamentals of Physics
ISBN: 978-0471758013
8th Extended edition
Authors: Jearl Walker, Halliday Resnick
Question Posted:
