New Semester
Started
Get
50% OFF
Study Help!
--h --m --s
Claim Now
Question Answers
Textbooks
Find textbooks, questions and answers
Oops, something went wrong!
Change your search query and then try again
S
Books
FREE
Study Help
Expert Questions
Accounting
General Management
Mathematics
Finance
Organizational Behaviour
Law
Physics
Operating System
Management Leadership
Sociology
Programming
Marketing
Database
Computer Network
Economics
Textbooks Solutions
Accounting
Managerial Accounting
Management Leadership
Cost Accounting
Statistics
Business Law
Corporate Finance
Finance
Economics
Auditing
Tutors
Online Tutors
Find a Tutor
Hire a Tutor
Become a Tutor
AI Tutor
AI Study Planner
NEW
Sell Books
Search
Search
Sign In
Register
study help
mathematics
statistics
Fundamentals Of Statistics 4th Edition Michael Sullivan III - Solutions
n = 75, p = 0.75, x = 60Compute P(x) using the binomial probability formula. Then determine whether the normal distribution can be used as an approximation for the binomial distribution. If so, approximate P(x) and compare the result to the exact probability.
n = 85, p = 0.8, x = 70Compute P(x) using the binomial probability formula. Then determine whether the normal distribution can be used as an approximation for the binomial distribution. If so, approximate P(x) and compare the result to the exact probability.
According to American Airlines, Flight 215 from Orlando to Los Angeles is on time 90% of the time. Randomly select 150 flights and use the normal approximation to the binomial to(a) approximate the probability that exactly 130 flights are on time.(b) approximate the probability that at least 130
Almanac, 80% of adult smokers started smoking before they were 18 years old. Suppose 100 smokers 18 years old or older are randomly selected. Use the normal approximation to the binomial to (a) approximate the probability that exactly 80 of them started smoking before they were 18 years old. (b)
In a recent poll, the Gallup Organization found that 45% of adult Americans believe that the overall state of moral values in the United States is poor. Suppose a survey of a random sample of 500 adult Americans is conducted in which they are asked to disclose their feelings on the overall state of
According to a study done by Nick Wilson of Otago University Wellington, the probability a randomly selected individual will not cover his or her mouth when sneezing is 0.267. Suppose you sit on a bench in a mall and observe 300 randomly selected individuals’ habits as they sneeze.(a) Use the
According to the Current Population Survey (Internet release date: September 15, 2004), 55% of males between the ages of 18 and 24 years lived at home in 2003. A survey is administered at a community college to 200 randomly selected male students between the ages of 18 and 24 years, and 130 of them
According to the Current Population Survey (Internet release date: September 15, 2004), 46% of females between the ages of 18 and 24 years lived at home in 2003. A survey is administered at a community college to 200 randomly selected female students between the ages of 18 and 24 years, and 110 of
In a Gallup poll, 37% of survey respondents said that, if they only had one child, they would prefer the child to be a boy. You conduct a survey of 150 randomly selected students on your campus and find that 75 of them would prefer a boy.(a) Approximate the probability that, in a random sample of
According to a USA Today “Snapshot,” 3% of Americans surveyed lie frequently. You conduct a survey of 500 college students and find that 20 of them lie frequently.(a) Compute the probability that, in a random sample of 500 college students, at least 20 lie frequently, assuming the true
Under what conditions is the sampling distribution of x̄ normal?
The total energy need during pregnancy is normally distributed, with mean µ = 2600 kcal/day and standard deviation σ = 50 kcal/day.(a) What is the probability that a randomly selected pregnant woman has an energy need of more than 2625 kcal/day? Is this result unusual?(b) Describe the sampling
A machine at K&A Tube & Manufacturing Company produces a certain copper tubing component in a refrigeration unit. The tubing components produced by the manufacturer have a mean diameter of 0.75 inch with a standard deviation of 0.004 inch. The quality-control inspector takes a random sample of 30
Based on data obtained from A. C. Nielsen, the mean number of televisions in a household in the United States is 2.24. Assume that the population standard deviation number of television sets in the United States is 1.38.(a) Do you believe the shape of the distribution of number of television sets
A Gallup survey indicated that 72% of 18- to 29-year-olds, if given a choice, would prefer to start their own business rather than work for someone else. A random sample of 600 18- to 29-year-olds is obtained today.(a) Describe the sampling distribution of pn, the sample proportion of 18- to
According to the U.S. Census Bureau, 10% of adults 25 years and older in the United States had advanced degrees in 2009. A researcher with the U.S. Department of Education surveys 500 randomly selected adults 25 years of age or older and finds that 60 of them have an advanced degree. Explain why
During the course of a typical season, suppose a batter has 500 at-bats. This means the player has the opportunity to get a hit 500 times during the course of a season. Further, suppose a batter is a career 0.280 hitter (he averages 280 hits every 1000 at-bats or he has 280 successes in 1000 trials
If a random sample of 36 is obtained from a population with mean 50 and standard deviation 24, what is the mean and standard deviation of the sampling distribution of the sample mean?
The charge life of a certain lithium ion battery for camcorders is normally distributed, with mean 90 minutes and standard deviation 35 minutes.(a) What is the probability that a randomly selected battery of this type lasts more than 100 minutes on a single charge? Is this result unusual?(b)
A machine used for filling plastic bottles with a soft drink has a known standard deviation of σ = 0.05 liter. The target mean fill volume is µ = 2.0 liters.(a) Describe the sampling distribution of x̄, the sample mean fill volume, for a random sample of 45 such bottles.(b) A quality-control
According to the National Center for Health Statistics (2004), 22.4% of adults are smokers. A random sample of 300 adults is obtained.(a) Describe the sampling distribution of , the sample proportion of adults who smoke.(b) In a random sample of 300 adults, what is the probability that at least 50
Peanut and tree nut allergies are considered to be the most serious food allergies. According to the National Institute of Allergy and Infectious Diseases, roughly 1% of Americans are allergic to peanuts or tree nuts. A random sample of 1500 Americans is obtained.(a) Explain why a large sample is
According to Wikipedia.com, net worth is defined as total assets (value of house, cars, money, etc.) minus total liabilities (mortgage balance, credit card debt, etc.). According to a recent study by TNS Financial Services, 7% of American households had a net worth in excess of $1 million
A simple random sample of size n = 10 is obtained from a population that is normally distributed with µ = 30 and σ = 8. What is the sampling distribution of x̄?
A simple random sample of size n = 40 is obtained from a population with µ = 50 and σ = 4. Does the population need to be normally distributed for the sampling distribution of x to be approximately normally distributed? Why? What is the sampling distribution of x̄?
Determine µx̄ and σx̄ from the given parameters of the population and the sample size.µ = 80, σ = 14, n = 49
Determine µx̄ and σx̄ from the given parameters of the population and the sample size.µ = 64, σ = 18, n = 36
Determine µx̄ and σx̄ from the given parameters of the population and the sample size.µ = 52, σ = 10, n = 21
Determine µx̄ and σx̄ from the given parameters of the population and the sample size.µ = 27, σ = 6, n = 15
Answer the following questions for the sampling distribution of the sample mean shown.(a) What is the value of µxÌ„? (b) What is the value of σxÌ„? (c) If the sample size is n = 16, what is likely true about the shape of the population? (d) If the sample
Answer the following questions for the sampling distribution of the sample mean shown.(a) What is the value of µxÌ„?(b) What is the value of σxÌ„?(c) If the sample size is n = 9, what is likely true about the shape of the population?(d) If the sample size is n = 9, what is the standard
A simple random sample of size n = 49 is obtained from a population with µ = 80 and σ = 14.(a) Describe the sampling distribution of x̄.(b) What is P(x̄ > 83)?(c) What is P(x̄ ≤ 75.8)?(d) What is P(78.3 < x̄ < 85.1)?
A simple random sample of size n = 36 is obtained from a population with µ = 64 and σ = 18.(a) Describe the sampling distribution of x̄.(b) What is P(x̄ < 62.6)?(c) What is P(x̄ ≥ 68.7)?(d) What is P(59.8 < x̄ < 65.9)?
A simple random sample of size n = 12 is obtained from a population with µ = 64 and σ = 17.(a) What must be true regarding the distribution of the population in order to use the normal model to compute probabilities involving the sample mean? Assuming that this condition is true, describe the
A simple random sample of size n = 20 is obtained from a population with µ = 64 and σ = 17.(a) What must be true regarding the distribution of the population in order to use the normal model to compute probabilities involving the sample mean? Assuming that thiscondition is true, describe the
The length of human pregnancies is approximately normally distributed with mean µ = 266 days and standard deviation σ = 16 days.(a) What is the probability a randomly selected pregnancy lasts less than 260 days?(b) Suppose a random sample of 20 pregnancies is obtained. Describe the sampling
The upper leg length of 20- to 29-year-old males is normally distributed with a mean length of 43.7 cm and a standard deviation of 4.2 cm.(a) What is the probability that a randomly selected 20- to 29-year-old male has an upper leg length that is less than 40 cm?(b) A random sample of 9 males who
The reading speed of second grade students is approximately normal, with a mean of 90 words per minute (wpm) and a standard deviation of 10 wpm.(a) What is the probability a randomly selected student will read more than 95 words per minute?(b) What is the probability that a random sample of 12
The most famous geyser in the world, Old Faithful in Yellowstone National Park, has a mean time between eruptions of 85 minutes. If the interval of time between eruptions is normally distributed with standard deviation 21.25 minutes, answer the following questions:(a) What is the probability that a
The S&P 500 is a collection of 500 stocks of publicly traded companies. Using data obtained from Yahoo! Finance, the monthly rates of return of the S&P 500 since 1950 are normally distributed. The mean rate of return is 0.007233 (0.7233%), and the standard deviation for rate of return is
Based on tests of the Chevrolet Cobalt, engineers have found that the miles per gallon in highway driving are normally distributed, with a mean of 32 miles per gallon and a standard deviation of 3.5 miles per gallon.(a) What is the probability that a randomly selected Cobalt gets more than 34 miles
The shape of the distribution of the time required to get an oil change at a 10-minute oil-change facility is unknown. However, records indicate that the mean time for an oil change is 11.4 minutes, and the standard deviation for oil-change time is 3.2 minutes.(a) To compute probabilities regarding
The quality-control manager of a Long John Silver’s restaurant wishes to analyze the length of time that a car spends at the drive-through window waiting for an order. According to records obtained from the restaurant, it is determined that the mean time spent at the window is 59.3 seconds with a
The Food and Drug Administration sets Food Defect Action Levels (FDALs) for some of the various foreign substances that inevitably end up in the food we eat and liquids we drink. For example, the FDAL for insect filth in peanut butter is 3 insect fragments (larvae, eggs, body parts, and so on) per
Suppose that cars arrive at Burger King’s drive-through at the rate of 20 cars every hour between 12:00 noon and 1:00 P.M. A random sample of 40 one-hour time periods between 12:00 noon and 1:00 P.M. is selected and has 22.1 as the mean number of cars arriving.(a) Why is the sampling distribution
The amount of time Americans spend watching television is closely monitored by firms such as A. C. Nielsen because this helps to determine advertising pricing for commercials.(a) Do you think the variable “weekly time spent watching television” would be normally distributed? If not, what shape
According to Crown ATM Network, the mean ATM withdrawal is $67. Assume that the standard deviation for withdrawals is $35.(a) Do you think the variable “ATM withdrawal” is normally distributed? If not, what shape would you expect the variable to have?(b) If a random sample of 50 ATM withdrawals
The following data represent the ages of the winners of the Academy Award for Best Actor for the years 2004–2009.004: Jamie Foxx ...........372005: Philip Seymour Hoffman .....382006: Forest Whitaker........452007: Daniel Day-Lewis ........502008: Sean Penn ...........482009: Jeff Bridges
The following data represent the running lengths (in minutes) of the winners of the Academy Award for Best Picture for the years 2004–2009.2004: Million Dollar Baby .....1322005: Crash ...........1122006: The Departed ........1512007: No Country for Old Men ....1222008: Slumdog Millionaire
In the game of roulette, a wheel consists of 38 slots numbered 0, 00, 1, 2, . . . , 36. To play the game, a metal ball is spun around the wheel and is allowed to fall into one of the numbered slots. If the number of the slot the ball falls into matches the number you selected, you win $35;
Technically, we assume that we are obtaining simple random samples from infinite populations when obtaining sampling distributions. If the size of the population is finite, we technically need a finite population correction factor. However, if the sample size is small relative to the size of the
For the three probability distributions shown, rank each distribution from lowest to highest in terms of the sample size required for the distribution of the sample mean to be approximately normally distributed. Justify your choice.
Suppose Jack and Diane are each attempting to use simulation to describe the sampling distribution from a population that is skewed left with mean 50 and standarddeviation 10. Jack obtains 1000 random samples of size n = 3 from the population, finds the mean of the 1000 samples, draws a histogram
n = 500, p = 0.4Describe the sampling distribution of . Assume that the size of the population is 25,000 for each problem.
n = 300, p = 0.7Describe the sampling distribution of . Assume that the size of the population is 25,000 for each problem.
n = 1000, p = 0.103Describe the sampling distribution of . Assume that the size of the population is 25,000 for each problem.
n = 1010, p = 0.84Describe the sampling distribution of . Assume that the size of the population is 25,000 for each problem.
A simple random sample of size n = 75 is obtained from a population whose size is N = 10,000 and whose population proportion with a speciï¬ed characteristic is p = 0.8.(a) Describe the sampling distribution of .(b) What is the probability of obtaining x = 63 or more individuals with the
A simple random sample of size n = 200 is obtained from a population whose size is N = 25,000 and whose population proportion with a speciï¬ed characteristic is p = 0.65.(a) Describe the sampling distribution of .(b) What is the probability of obtaining x = 136 or more individuals with the
A simple random sample of size n = 1000 is obtained from a population whose size is N = 1,000,000 and whose population proportion with a specified characteristic is p = 0.35.(a) Describe the sampling distribution of .(b) What is the probability of obtaining x = 390 or more individuals with the
A simple random sample of size n = 1460 is obtained from a population whose size is N = 1,500,000 and whose population proportion with a specified characteristic is p = 0.42.(a) Describe the sampling distribution of .(b) What is the probability of obtaining x = 657 or more individuals with the
According to a study done by Wakefield Research, the proportion of Americans who can order a meal in a foreign language is 0.47.(a) Suppose a random sample of 200 Americans is asked to disclose whether they can order a meal in a foreign language. Describe the sampling distribution of , the
According to a study done by the Gallup organization, the proportion of Americans who are satisfied with the way things are going in their lives is 0.82.(a) Suppose a random sample of 100 Americans is asked, “Are you satisfied with the way things are going in your life?” Describe the sampling
According to a study done by the Pew Research Center, 39% of adult Americans believe that marriage is now obsolete.(a) Suppose a random sample of 500 adult Americans is asked whether marriage is obsolete. Describe the sampling distribution of , the proportion of adult Americans who believe marriage
According to creditcard.com, 29% of adults do not own a credit card.(a) Suppose a random sample of 500 adults is asked, “Do you own a credit card?” Describe the sampling distribution of , the proportion of adults who own a credit card.(b) What is the probability that in a random sample of 500
According to a study conducted by the Gallup organization, the proportion of Americans who are afraid to fly is 0.10. A random sample of 1100 Americans results in 121 indicating that they are afraid to fly. Explain why this is not necessarily evidence that the proportion of Americans who are
Exit polling is a popular technique used to determine the outcome of an election prior to results being tallied. Suppose a referendum to increase funding for education is on the ballot in a large town (voting population over 100,000). An exit poll of 310 voters finds that 164 voted for the
A shipment of 50,000 transistors arrives at a manufacturing plant. The quality control engineer at the plant obtains a random sample of 500 resistors and will reject the entire shipment if 10 or more of the resistors are defective. Suppose that 4% of the resistors in the whole shipment are
sample proportion of adults who respond yes, is approximately normal, how many more adult Americans does the researcher need to sample if(a) 10% of all adult Americans support the changes?(b) 20% of all adult Americans support the changes?
(a) 90% of all teenagers aged 13 to 17 have never been prescribed medication for ADHD?(b) 95% of all teenagers aged 13 to 17 have never been prescribed medication for ADHD?
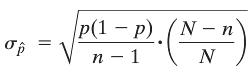
In this section, we assumed that the sample size was less than 5% of the size of the population. When sampling without replacement from a finite population in which n > 0.05N, the standard deviation of the distribution of pn is given bywhere N is the size of the population. A survey is conducted
Find the critical t-value for constructing a confidence interval for a population mean at the given level of confidence for the given sample size,n. (a) 99% confidence;n = 18 (b) 90% confidence;n = 27
What does the 95% represent in a 95% confidence interval?
Which is larger, the area under the t-distribution with 10 degrees of freedom to the right of t = 2.32 or the area under the standard normal distribution to the right of z = 2.32? Why?
State the properties of Student’s t-distribution.
A simple random sample of size n is drawn from a population. The sample mean, x̄, is 54.8 and the sample standard deviation is10.5.(a) Construct the 90% confidence interval for the population mean if the sample size, n, is 30.(b) Construct the 90% confidence interval for the population mean if
A simple random sample of size n is drawn from a population that is known to be normally distributed. The sample mean, x, is determined to be 104.3 and the sample standard deviation, s, is determined to be 15.9.(a) Construct the 90% confidence interval for the population mean if the sample size,
In a survey of 35 adult Americans, it was found that the mean age (in years) that people would like to live to is 87.9 with a standard deviation of 15.5.An analysis of the raw data indicates the distribution is skewed left.(a) Explain why a large sample size is necessary to construct a confidence
One question asked in the General Social Survey was this: “How many e-mails do you send in a day?” The results of 928 respondents indicate that the mean number of e-mails sent in a day is 10.4, with a standard deviation of 28.5.(a) Given the fact that 1st and ard deviation to the left of the
Researchers conducted an experiment to determine the effectiveness of a commercial caffeinated carbohydrate–electrolyte sports drink compared with aplacebo. Sixteen highly trained cyclists each completed two trials of prolonged cycling in a warm environment, one while receiving the sports drink
A random sample of 60 married couples who have been married 7 years was asked the number of children they have.The results of the survey are as follows:(a) What is the shape of the distribution of the sample mean? Why?(b) Compute a 95% conï¬dence interval for the mean number of children of all
The diameter of the Douglas ï¬r tree is measured at a height of 1.37 meters.The following data represent the diameter in centimeters of a random sample of 12 Douglas ï¬rs in the western Washington Cascades.(a) Obtain a point estimate for the mean and standard deviation diameter of a Douglas
In a random sample of 678 adult males 20 to 34 years of age, it was determined that 58 of them have hypertension (high blood pressure).(a) Obtain a point estimate for the proportion of adult males 20 to 34 years of age who have hypertension.(b) Construct a 95% confidence interval for the
Find the critical t-value for constructing a confidence interval about a population mean at the given level of confidence for the given sample size,n. (a) 96% confidence; n = 26 (b) 98% confidence; n = 18
Determine the point estimate of the population mean and margin of error if the confidence interval has lower bound: 125.8 and upper bound: 152.6.
A question on the 2006 General Social Survey was this: “How many family members do you know that are in prison?” The results of 499 respondents indicate that the mean number of family members in jail is 1.22, with a standard deviation of 0.59.(a) What shape would you expect the distribution of
A random sample of 50 recent college graduates results in a mean time to graduate of 4.58 years, with a standard deviation of 1.10 years.(a) Compute and interpret a 90% confidence interval for time to graduate with a bachelor’s degree.(b) Does this evidence contradict the widely held belief that
The campus at Joliet Junior College has a lake.A student used a Secchi disk to measure the clarity of the lake€™s water by lowering the disk into the water and measuring the distance below the water surface at which the disk is no longer visible. The following measurements (in inches) were
From a random sample of 1201 Americans, it was discovered that 1139 of them lived in neighborhoods with acceptable levels of carbon monoxide. Source: Environmental Protection Agency.(a) Obtain a point estimate for the proportion of Americans who live in neighborhoods with acceptable levels of
A tennis enthusiast wants to estimate the mean length of men€™s singles matches held during the Wimbledon tennis tournament. From the Wimbledon history archives, he randomly selects 40 matches played during the tournament since the year 1968 (when professional players were ï¬rst allowed to
Lower bound: 0.201, upper bound: 0.249, n = 1200 Determine the point estimate of the population proportion, the margin of error for each confidence interval, and the number of individuals in the sample with the specified characteristic, x, for the sample size provided.
Determine the point estimate of the population proportion, the margin of error for each confidence interval, and the number of individuals in the sample with the specified characteristic, x, for the sample size provided. Lower bound: 0.051, upper bound: 0.074, n = 1120
Determine the point estimate of the population proportion, the margin of error for each confidence interval, and the number of individuals in the sample with the specified characteristic, x, for the sample size provided. Lower bound: 0.462, upper bound: 0.509, n = 1680
Determine the point estimate of the population proportion, the margin of error for each confidence interval, and the number of individuals in the sample with the specified characteristic, x, for the sample size provided. Lower bound: 0.853, upper bound: 0.871, n = 10,732
Construct a confidence interval of the population proportion at the given level of confidence.x = 30, n = 150, 90% confidence
Construct a confidence interval of the population proportion at the given level of confidence.x = 80, n = 200, 98% confidence
Construct a confidence interval of the population proportion at the given level of confidence.x = 120, n = 500, 99% confidence
Construct a confidence interval of the population proportion at the given level of confidence.x = 400, n = 1200, 95% confidence
Construct a confidence interval of the population proportion at the given level of confidence.x = 860, n = 1100, 94% confidence
Construct a confidence interval of the population proportion at the given level of confidence.x = 540, n = 900, 96% confidence
Showing 12300 - 12400
of 88243
First
117
118
119
120
121
122
123
124
125
126
127
128
129
130
131
Last
Step by Step Answers
.png)
.png)
.png)
.png)
.png)
-1.png)
-2.png)
.png)
-1.png)
-2.png)

