New Semester
Started
Get
50% OFF
Study Help!
--h --m --s
Claim Now
Question Answers
Textbooks
Find textbooks, questions and answers
Oops, something went wrong!
Change your search query and then try again
S
Books
FREE
Study Help
Expert Questions
Accounting
General Management
Mathematics
Finance
Organizational Behaviour
Law
Physics
Operating System
Management Leadership
Sociology
Programming
Marketing
Database
Computer Network
Economics
Textbooks Solutions
Accounting
Managerial Accounting
Management Leadership
Cost Accounting
Statistics
Business Law
Corporate Finance
Finance
Economics
Auditing
Tutors
Online Tutors
Find a Tutor
Hire a Tutor
Become a Tutor
AI Tutor
AI Study Planner
NEW
Sell Books
Search
Search
Sign In
Register
study help
mathematics
statistics
Understanding Business Statistics 1st edition Stacey Jones, Tim Bergquist, Ned Freed - Solutions
A survey of 1200 randomly selected “individual” hotels in China was conducted to determine the number of guests served, annual hotel income, and the average number of hotel employees. a. If the average number of employees per hotel in the sample was 28, with a sample standard deviation of 12
It has been reported that American taxpayers spend 6.6 billion hours filling out tax forms each year. You take a random sample of 1500 taxpayers and find the average time filling out tax forms for the sample is 28.4 hours, with a sample standard deviation of 5.7 hours. a. Use sample results to
You plan to select a simple random sample in order to estimate the average course load for freshman students at Brighton College. From the freshman class of 1600, you randomly choose 16 students, with the following results: sample mean = 16.2 credit hours, sample standard deviation = 5.3 credit
Refer to Exercise 61. Which, if any, of the following factors would force you to change your answers? For each of the factors listed, discuss your reasoning. (Consider each part independent of the others.)a. The size of the company employee population is known to be 5000.b. The shape of the
The Placement Office at the University of Tennessee has taken a simple random sample of 64 seniors from the large senior class at UT in order to estimate the average number of job interviews that UT seniors have scheduled. The sample average is 3.4 interviews; the sample standard deviation is 1.6
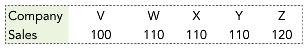
Five companies make up the steel industry in the US. Last year’s sales for each of the companies (in $millions) are shown below:a. Show all 10 equally likely samples of size three that could be selected from this company population. b. Calculate the mean sales for each
Refer to Exercise 79. Suppose a preliminary estimate of the population standard deviation will come from a pilot sample of five new accountants showing the following values:Determine the appropriate size of the full sample to be taken for the study.
The Iowa Department of Public Education plans to select a simple random sample of teachers to estimate the aver-age days of sick leave taken last year by public school teachers in the state. Coordinators of the study initially decide to construct a confidence interval that is no wider than ± .5
Refer to Exercise 82. Suppose Centennial is interested in conducting the study only for the Portland, Oregon, metropolitan area, where the list of nurses in the targeted category has just 245 names. What sample size would you recommend?In ExerciseCentennial Medical Research plans to conduct a
Q-Market Toys plans to take a sample of retail outlets nationwide in order to estimate the average selling price of its chief competitor’s new kids’ eBook reader. You want to eventually construct an estimate at the 95% confidence level that shows a margin of error no greater than $.50. Previous
In the chapter, we discussed briefly the rationale for using n –1 in the calculation of s, a sample standard deviation intended to serve as an estimate of σ, the population standard deviation. We suggested that if we use n rather than n – 1 in the calculation, we would produce estimates of σ
The years of prior work experience for five recently hired software developers at MindGames.com are shown below:a. Show all 10 equally likely samples of size two that could be selected from this employee population.b. Calculate the mean years of experience for each of the 10 samples. c. Produce a
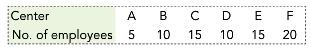
The table below shows the number of employees at the six fitness centers owned by Workouts International.a. Show the six equally likely samples of size five that could be selected from this population. b. Calculate the mean number of employees for each of the six
Suppose you plan to draw all possible samples of size 64 from a large population with a mean (µ) of 2500 and a standard deviation (σ) of 32. You then will compute the mean (x-bar) for each sample. a. Sketch the sampling distribution that you would expect to produce here. b. What value should you
Suppose you were to draw all possible samples of size 36 from a large population with a mean (µ) of 800 and a standard deviation (σ) of 120. You then will compute the mean (x) for each sample. a. Sketch a graph of the sampling distribution here and center it properly. Compute the standard
Suppose you intend to draw a sample of 100 residents from the large population of residents living in Blanchard County, Mississippi. You plan to compute the mean age (x) in the sample. The most recent Census shows that the average age of Blanchard County residents is 38 years, with a standard
Evan Weaver, the lead engineer in Twitter’s services team, reports that the population of Twitter users has an average of 126 followers. Assume the standard deviation in this population is 30 followers. You plan to draw a sample of 225 Twitter users.a. What is the probability that the average
According to credit reporting agency Experian, the population of consumer credit card holders carries an average credit card balance of $5500, with a standard deviation of $750. You plan to draw a random sample of 625 credit card holders from this population. a. What is the probability that
According to the Nielsen Company, teenagers between the ages of 13 and 17 send an average of 3340 text messages per month, or more than six texts every waking hour. You plan to draw a random sample of 900 teenagers from this 13-to-17 population. Assuming that the standard deviation for the
For the distribution of the sample means that you produced in Exercise 7 (truck odometers),a. Show that the mean of the distribution is equal to the population mean.b. Compute the standard deviation of the distribution directly from the table or bar chart that describes the distribution.c. Show
For the distribution of the sample means that you produced in Exercise 8 (steel companies), a. Show that the mean of the distribution is equal to the population mean. b. Compute the standard deviation of the distribution directly from the table or bar chart that describes
Graziano Construction has received a large shipment of steel reinforcing rods. The company needs to test a sample of the rods for breaking strength before the rods are installed. The site engineer selects a simple random sample of 49 of these reinforcing rods from the shipment and finds that the
For its “Teenage Life Online” report, representatives of the Pew Internet and American Life Project con-ducted phone interviews with 754 randomly selected young people between the ages of 12 and 17 to learn about the Internet habits of US teenagers a. If the survey reports that the average time
Minor league baseball is seen by many as one of the few remaining forms of affordable sports entertainment still available to families. (See “It’s a Homerun: Customer Service Greatness in the Minor Leagues,” D. Carter, D. Rovell.) If a random sample of 40 minor league ball-parks is surveyed
Each year, the American Federation of Teachers (AFT) reports the state-by-state average salary for teachers in public schools. In a recent study, the AFT reported an average salary of $60,583 for teachers in California, ranking the state sixth in the country. If this California average was based on
MPA Worldwide Market Research found the average age in a random sample of adult moviegoers was 39 (source: commercialalert.org/moviemadem.htm). If the sample size was 1000 and the population standard deviation is 9.5 years, a. Construct a 90% confidence interval estimate of the mean age of all
The Canadian Retail Council conducted a survey of advertising budgets for various types of businesses in Canada. The survey reported that the average advertising budget for a random sample of furniture stores was 7.1 percent of sales (source: tekvantage.com). Assume that the population standard
You want to build a 90% confidence interval estimate of a population mean. You take a sample of size 100, and find a sample mean of 1300. If the population standard deviation is 25, calculate the a. Standard error of the sampling distribution of the sample mean. b. Margin of error for your
Refer to Exercise 19. There you selected a simple random sample of 49 units from a large shipment and found that the sample average breaking strength was 814 pounds. Assuming that the standard deviation of the breaking strengths for the population of units in the shipment is known to be 35 pounds,
The average annual expense for groceries in a 2012 random sample of 600 US households is $8562. If the standard deviation of grocery expenses in the population of US households is $1230, compute the a. Standard error of the sampling distribution of the sample mean that could be used here to
The Census Bureau of the US Department of Commerce estimated that average e-commerce sales for US retailers in the second quarter of 2011 had increased by 3.0 percent from the first quarter of 2011. Along with the estimate, a margin of error of 1.2 percent (at the 95% confidence level) was
In a study done by the Society of Human Resources Management, a random sample of 341 human resource professionals were asked, “On average, how many paid vacation days does your organization offer to employees who have been with the organization for 10 years or more?” The average response was
Use the t table to determine the following t values: a. 90% of the values in a t distribution with 20 degrees of freedom will be less than or equal to ______. b. 1% of the values in a t distribution with 15 degrees of freedom will be greater than ______. c. 99 % of the values in a t
Use the t table to determine the proper boundaries for the a. 80% interval, where df = 9. b. 95% interval, where df = 17. c. 98 % interval, where df = 24 .
Use the t table to determine the following t values: a. 95% of the values in a t distribution with 17 degrees of freedom will be less than or equal to ______. b. 1% of the values in a t distribution with 11 degrees of freedom will be greater than ______. c. 90% of the values in a t
Use the t table to determine the following t values: a. 99% of the values in a t distribution with 18 degrees of freedom will be less than or equal to ______. b. 1% of the values in a t distribution with 10 degrees of freedom will be greater than ______. c. 95% of the values in a t
A simple random sample of size 3 has produced sample values 120, 130, and 140. Assume the population distribution of values is normal. a. Compute the sample average, x, and the sample standard deviation, s. b. Show the 95% confidence interval estimate of the population mean.
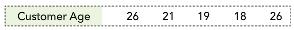
Land’s End wants to determine the average age of customers who purchase products through its catalog sales department. The company has contacted a simple random sample of 5 customers, with the following results:Assume the population distribution of customer ages is normal. a. Compute
The Lundberg Survey monitors gas prices at gas stations nationwide. In a recent month, Lundberg reported that the average regular gas price for the stations it surveyed was $3.506 per gallon. Assume the population distribution of gas prices is normal. If the sample size was 20 stations and the
Average weight gain for a sample of 25 patients who took the experimental anti-anxiety drug Ferin in a controlled six-month experiment was 21.4 lbs., with a sample standard deviation of 5.1 lbs. Assume the population distribution of weight gain for all patients who take Ferin is normal. a. Build a
For each of the cases below, show the appropriate t - value and the approximating normal z value: a. Confidence level = 80%, df = 40. b. Confidence level = 99%, df = 9.
For each of the cases below, show the appropriate t - value and the approximating normal z value: a. Confidence level = 98%, df = 20. b. Confidence level = 90%, df = 2.
The marketing division at Apex Telecom consists of four people. Two of the four will be randomly selected to attend a sales conference at the end of the year. If we designate the four people in the division as W, X, Y, and Z, list all the equally likely samples of size two that you might choose if
For each of the cases below, show the appropriate t - value and the approximating normal z value: a. Confidence level = 95%, df = ∞. b. Confidence level = 99%, df = ∞.
CompuTrade, an online stock-trading service, has over 25,000 clients. To estimate the average number of trades made last month by CompuTrade’s clients, you take a simple random of 250 clients and find the average number of trades in the sample is 45.8, with a sample standard deviation of 12.3.
In an advertising study done for Milestone magazine, a random sample of Milestone subscribers was selected. Each subscriber in the sample was asked to recall advertisements in this month’s edition of the magazine. The average number of advertisements recalled by sample members was 8.2, with a
To explore how unemployment compensation returns money to the economy, the state of Washington annually conducts a study of household expenditures for claimants who received unemployment compensation from the state. In a recent study, a random sample of 1049 claimants was surveyed from a population
To estimate the average daily consumption (in milligrams) of nutritional supplements taken by professional baseball players, a sample of players is randomly selected from the population of major league and minor league players. For the sample, average daily consumption is reported to be 1940 mg.,
In telephone interviews with a random sample of 1100 adults nationwide conducted by the American Research Group, shoppers said they were planning to spend an average of $976 for gifts this holiday season. a. If the standard deviation of planned spending for the sample was $180, show the 95%
You plan to take a random sample from a population of 500 items and build a 95% confidence interval estimate of the population mean. a. You want a margin of error no bigger than ± 5. You estimate the population standard deviation to be 100. How large a sample is needed? b. Suppose you want the
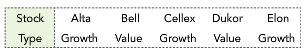
The following list shows the five stocks that make up your stock portfolio. Each stock is identified as either a growth stock or a value stock.You plan to select a random sample of three of the stocks to research. List all the equally likely samples that you might choose if you
In a sample survey of 68 high-tech companies, Culpepper and Associates reported that the average training budget per employee for companies in the sample was $894. If the sample was selected from a population of 1320 companies, and the standard deviation for the sample was $446, a. Estimate the
The table shows the names of the sales staff at Richards & Jacobs Securities, together with the number of major accounts that each one services:a. Using sampling without replacement, show all four possible samples of size three that could be selected from this population. b. Show the
Suppose you were to draw all possible samples of size 81 from a large population with a mean (µ) of 54.0 and a standard deviation (σ) of 18.0. You then compute the mean (x) for each sample. From the long list of sample means that results, you want to create the sampling distribution of the sample
Suppose you were to draw all possible samples of size 36 from a large population with a mean of 650 and a standard deviation of 24. You then compute the mean (x) for each sample. From the long list of sample means that you produce, you want to create the sampling distribution of the sample mean,
Zillow.com reported that the mean value per square foot for homes in the Phoenix, Arizona, area dropped from $172 in 2006 to $66 in 2011 (source: zillow.com/local-info/AZ-Phoenix-Metro-home-value/). Suppose you now intend to draw a sample of 49 homes. You plan to compute the mean value per square
Solar panels produced by Perfect Circle Technology (corporate motto: Don’t Be Oval) have an average life of 16.7 years, with a standard deviation of 1.2 years. A random sample of 36 Perfect Circle panels is selected. a. What is the probability that the average panel life in the sample will be
For the list of possible sample means that you produced in Exercise 53. a. Once again show the table and the bar chart for the sampling distribution and comment on the shape of the distribution. b. Show that the mean of the sample means that make up the sampling distribution is exactly equal to
You want to estimate the average SAT score for all students who took the Ethan-Davies SAT Preparation course during the past 2 years. You select a simple random sample of 100 such students from a comprehensive list of all Davies students who took the course over the last two years and find that the
Listed here are the six members of the Council of Oil and Petroleum Exporting Countries: Argentina, Bahrain, Colombia, Dubai, Ecuador, and Oman. You plan to take a sample of these member countries in order to estimate the group’s proven oil reserves. List all the equally likely samples if you use
In a study focused on the shortage of pharmacists in the United States, a simple random sample of 250 newly hired pharmacists was selected and sent a questionnaire. One of the questions dealt with the size of the “signing bonus” that a newly hired pharmacist received for joining his/her current
You want to estimate the average years of seniority for employees working for Kaneko Ltd. The files of 49 workers are selected at random. Average seniority for those in the sample is 13.6 years. Assume you know the population standard deviation is 5.2 years. a. Construct and interpret a 95%
You have four stocks in your portfolio. Three of the stocks decreased in value this month, while the value of one increased:a. List the four possible samples of size 3 that could be selected from this population of stocks. b. For each of the four samples, determine the proportion of stocks
Refer to Exercise 2. a. Show the bar chart for the sampling distribution and comment on its shape. b. Show that the mean of the sampling distribution is exactly equal to the population proportion, c. Compute the standard deviation (p) of the sampling distribution directly from the
Refer to Exercise 98. Assume the calorie data were produced from two independent samples rather than from matched samples. Use the independent samples approach to produce a 90% confidence interval estimate of the average difference in calorie intake for the populations represented and compare your
In small sample cases where we are estimating the difference between two population means and the population standard deviations are unknown, we used an approach in which we assumed that the two population standard deviations were equal. Under this assumption, we pooled the sample standard
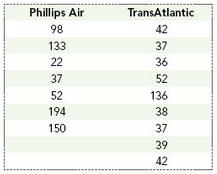
The table shows a sample of late arrival times (in minutes) for two major airlines flying the route from New York’s Kennedy Airport to London’s Gatwick Airport.a. Use a 95% confidence level and construct the appropriate interval estimate of the difference in average late arrival times for the
A random sample from a large population produces a sample proportion of .4. Sample size is 500. Build and interpret the 95% confidence interval estimate of the population proportion.
A random sample from a large population produces a sample proportion of .65. Sample size is 100. Build and interpret the 90% confidence interval estimate of the population proportion.
A random sample from a large population produces a sample proportion of .3. Sample size is 400. a. Build and interpret the 95% confidence interval estimate of the population proportion. b. Identify the margin of error term in your interval. c. Identify the standard error term in your interval.
In the 2011 CFO Outlook survey done by Bank of America, 801 CFOs (chief financial officers) of American manufacturing and services companies were randomly chosen and asked about their views of the economy. In the sample, 64% expected revenue growth for their companies in the upcoming year. Forty
For the intervals in Exercise 14, identify the standard error term and the margin of error term.In ExerciseIn the 2011 CFO Outlook survey done by Bank of America, 801 CFOs (chief financial officers) of American manufacturing and services companies were randomly chosen and asked about their views of
Interpret the intervals you constructed in Exercise 14. In exercise In the 2011 CFO Outlook survey done by Bank of America, 801 CFOs (chief financial officers) of American manufacturing and services companies were randomly chosen and asked about their views of the economy. In the sample, 64%
Since the financial scandals of the early 2000s, companies have been working to improve their internal audit procedures. In a study conducted by the Global Auditing Information Network (GAIN), 42 of the 165 randomly selected American companies surveyed said they would substantially increase the
In a field study involving a random sample 901 fulltime employees from a cross section of companies in the Southern California area, attitudes toward technology were measured. The study found that 9% of the employees in the sample could be classified as technology “resistors”— people who
The Internal Revenue Service (IRS) is conducting a study to determine the percentage of taxpayers who overpaid their taxes last year. In a sample of 2500 taxpayer returns, the IRS found that 780 taxpayers had overpaid.a. Build a 99% confidence interval estimate of the percentage of all American
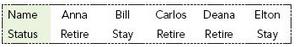
There are five people in the human resource department of Hobson’s Choice Meats. Three are planning to retire next year; two expect to stay for at least three more years.a. List the five possible samples of size 4 that could be selected from the department. b. Show the proportion of people
In a study of Dallas area restaurants conducted over a five year period, 118 of the restaurants in a sample of 515 new restaurants failed within the first year (source: restaurant edge. com). a. Build a 90% confidence interval estimate of the proportion of all new Dallas area restaurants that
The software industry in India has become a major force in software systems development worldwide. A survey of Indian practitioners who do design and usability work for such systems was conducted. In the survey of 111 randomly selected practitioners, 82 said they had at least a master’s degree
In a study done in the state of Wyoming to detect the presence of CWD, a serious disease in deer, the Wyoming Game and Fish Department selected a random sample of 4300 mule deer from a total population of approximately 500,000 mule deer in the state. The disease was detected in 98 of the mule deer
According to the latest census, there are 200 million Americans aged 20 and over. You want to estimate the number of Americans in this age group who are without health insurance. You plan to select a random sample and use sample results to build a 90% confidence interval. You want a sample size
You plan to build a 99% confidence interval estimate of a population proportion. You want the interval to be no wider than + .05. You have no information about the value of. a. How big a sample would be appropriate? b. Suppose a pilot sample had given .2 as an estimate of the population proportion.
You are planning to conduct an audit of Greystone Company’s financial statements. As part of the audit, you will select a random sample of accounts receivable in order to estimate the proportion of Greystone’s accounts receivable that are at least 3 months overdue. a. How many accounts should
Hi Shear Corporation of Torrance California has very specific procedures for testing the quality of its product, Hi Set metal fasteners. One of the product characteristics that is monitored is surface texture. Company inspectors draw a random sample of a given size from each large production lot
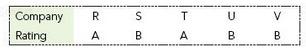
Campos Computing provides IT services to five companies in the region. Two of the companies rate the service “A” and three rate the service “B.”a. List the 10 possible samples of size 3 that could be selected from this population of companies. b. Show the proportion of companies in
You take a random sample of size 50 from Population1 and a random sample of size 100 from Population 2. The mean of the first sample is 1550; the sample standard deviation is 220. The mean of the second sample is 1270; the sample standard deviation is 180. Show the 95% confidence interval estimate
In a study done by the Scottish government, the average weekly earnings for men were found to be substantially higher than for women. Specifically, the average gross individual weekly income for a random sample of men was £ 317; for a random sample of women, it was £ 172 (source: Social Focus on
In a series of tests conducted to compare two CD ROM drives, storagereview.com looked at the performance of the Kenwood UCR004010 and the Plextor UltraPlex PX 32Tsi. One of the characteristics of interest was “outside transfer rate,” the rate at which the drives are able to transfer data on the
In a study of the video game culture among young people in Canada, a six page questionnaire was completed by a random sample of kids between the ages of 11 and 18. The sample was gathered from.
You take a simple random sample of size 10 from Population1 and a simple random sample of size 12 from Population 2. The mean of the first sample is 150; the sample standard deviation is 25. The mean of the second sample is 133; the sample standard deviation is 21. Show the 95% confidence interval.
You take a simple random sample of size 8 from Population1 and a simple random sample of size 12 from Population 2. The mean of the first sample is 24; the sample standard deviation is 4. The mean of the second sample is 18; the sample standard deviation is 5. Show the 90% confidence interval
For the situation described in Exercise 33 (testing the two CD ROM drives), suppose sample sizes had each been10 instead of 35. Revise your confidence interval estimate.
Numerous surveys have documented excessive drinking among college students. Suppose a random sample of 10 freshman students and a random sample of 15 senior students at Boylston University are selected to participate in a study. Each student in the sample is asked to record his/ her beer
In a county wide study, two segments of the Washington County (Wisconsin) population were surveyed about social service needs. One group, referred to as “key informants,” was composed of 77 county leaders: elected officials, business people, and community service providers. The second group
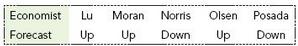
Five economists have published recent forecasts for the upcoming fiscal year. Three of the economists predict an upturn in the economy. Two predict a downturn.a. List the 10 possible samples of size 2 that could be selected from this population of economists. b. Show the proportion of
You plan to estimate the difference in two population proportions by taking a random sample of size 500 from each of the two populations. The sample from Population1 has a sample proportion of .35. The sample from Population 2 has a sample proportion of .22. Show the 95% confidence interval
Recently Burke Inc. Conducted research focused on the primary employee feedback tools used by companies to listen to employee concerns. The sample was composed of 50 Fortune 500 companies and 161 midsized companies. Company representatives in senior human resource positions were contacted. In the
In a sample survey conducted by researchers at Indiana University’s School of Journalism, 1,149 US print journalists were asked about political party affiliation. The percentage of journalists in the sample who claimed to be Democrats was 37%. In a Gallup poll of 1,003 broadcast journalists
Two proposed advertising campaign themes for a new product are being evaluated. A random sample of 100 consumers is exposed to theme A and another sample of 100 consumers is exposed to theme B. At the conclusion of the study participants in each sample are asked whether they have a positive opinion
The director of human resources at Corcoran and Rios wants to estimate the difference between the Proportion of male employees who smoke and the proportion of female employees who smoke. She takes a simple random sample of 100 male employees from the population of male employees at the firm and
Showing 21400 - 21500
of 88243
First
208
209
210
211
212
213
214
215
216
217
218
219
220
221
222
Last
Step by Step Answers
.png)
.png)
.png)
.png)