New Semester
Started
Get
50% OFF
Study Help!
--h --m --s
Claim Now
Question Answers
Textbooks
Find textbooks, questions and answers
Oops, something went wrong!
Change your search query and then try again
S
Books
FREE
Study Help
Expert Questions
Accounting
General Management
Mathematics
Finance
Organizational Behaviour
Law
Physics
Operating System
Management Leadership
Sociology
Programming
Marketing
Database
Computer Network
Economics
Textbooks Solutions
Accounting
Managerial Accounting
Management Leadership
Cost Accounting
Statistics
Business Law
Corporate Finance
Finance
Economics
Auditing
Tutors
Online Tutors
Find a Tutor
Hire a Tutor
Become a Tutor
AI Tutor
AI Study Planner
NEW
Sell Books
Search
Search
Sign In
Register
study help
mathematics
statistics
Understanding Business Statistics 1st edition Stacey Jones, Tim Bergquist, Ned Freed - Solutions
The following frequency distribution table shows staffing levels (number of officers reporting) for the 50 most recent shifts at Metropolitan Police Headquarters:Staff Level (Number of Officers) x Number of
In a survey of National Hockey League players, 75 players were asked how many teeth they had lost due to contact during games. Survey results are as follows:Missing Teeth x No. of Players
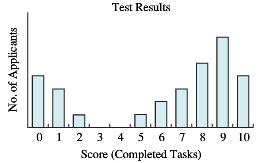
A10-task aptitude test was given to 300 recent job applicants at Detroit Fabrication Industries. The number of successfully completed tasks was recorded for each applicant. The bar chart below summarizes results:a. In one or two sentences, summarize the information that the chart is providing.b.
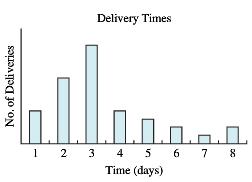
The frequency bar chart shows last month’s delivery times for packages shipped through National Express by customers who used National’s three-day delivery time option.a. In one or two sentences, summarize the information that the chart is providing.b. Show the approximate location of the mean,
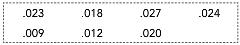
The following relative frequency distribution table reports results from a recent study of prices charged by retailers who carry your company’s product:Price x Proportion
Kelly Manufacturing tracks production line stoppages per day of operations. The following relative frequency distribution table lists the number of stoppages over the last 200 days:Stoppages xProportion of Days
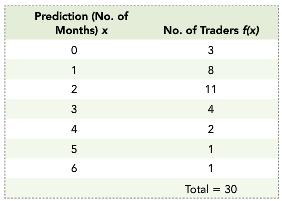
Thirty stock traders on the floor of the New York Stock Exchange were asked to predict the number of consecutive months in which the NYSE Index would continue to increase. Responses were as follows:a. Show the survey results in a “less than or equal to” cumulative frequency table. b.
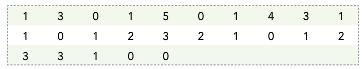
Below is a table showing the number of scratches found in each of 25 8-foot plastic panels inspected by Quality Control.a. Show the results in a “less than or equal to” cumulative frequency table. b. Show the results in a “greater than or equal to” cumulative frequency
Use the data in Exercise 67 to construct a “less than or equal to” cumulative relative frequency table.In exercise
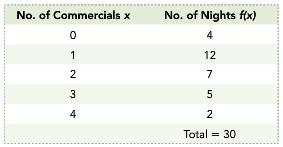
Below is a frequency distribution table showing the number of your company’s television commercials that appeared in prime time viewing hours during each of the past 30 nights:Show the data in a a. “Less than or equal to” cumulative relative frequency table. b. “Greater than or
As mentioned in the note in section 2.1, PewInternet.org reports that young adults between the ages of 18 and 24 who text send or receive an average of 109.5 text messages per day. The same poll found that the median texter in this age group sends or receives 50 texts per day—which means that
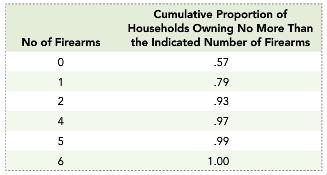
Below is a “less than or equal to” cumulative relative frequency table showing the results of a National Rifle Association survey of gun ownership in Oregon. The table is based on data collected from 2000 Oregon residents:a. Show the relative frequency table that’s the basis of this “less
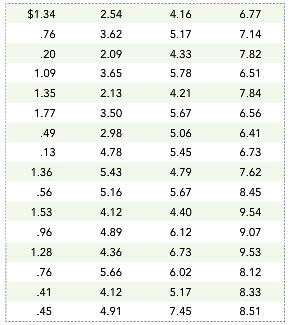
Below is a table of hourly wages being paid to workers doing comparable assembly work in various countries?a. Show the values in a grouped-data frequency table, using classes $0 to under $2, $2 to under $4, $4 to under $6, and so on. b. Draw the histogram for the table in part a. c. Using
For the data in Exercise 71, set up a grouped data frequency table using classes 0 to under 3, 3 to under 6, and 6 to under 9, and 9 to under 12. In exercisea. Draw the histogram. b. Estimate the mean, the variance and the standard deviation for the values represented in the table.
For the data in Exercise 71, set up a grouped data frequency table using classes 0 to under 5 and 5 to under 10.In exercisea. Draw the corresponding histogram. b. Use the grouped data table to estimate the mean, the variance and the standard deviation.
The following table of grouped data summarizes results from a study of 150 regional companies in the wood products industry. Each company reported the number of full-time workers it employs:a. Draw the histogram. b. Estimate the mean, the variance and the standard deviation of the employee
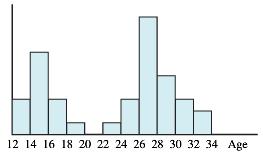
American Demographics reports the age distribution of consumers who bought tabloid newspapers / magazines during the past year*To simplify your calculations, assume the last age group is 65 to 80. The intervals are not all the same width. a. Draw the corresponding histogram. b. Estimate the mean,
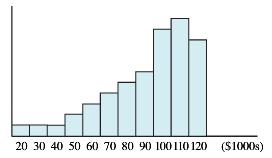
Below is a relative frequency table showing American household incomes as reported in the 2000 Census?*To simplify your calculations, assume the last income class is $200,000 to $300,000. Notice that the classes become wider at higher levels of income. a. Draw the corresponding histogram. b.
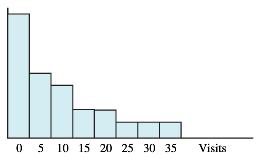
A recent study collected data from 300 shoppers who recently purchased one or more items at Kari H Junior Fashions in the First Avenue Mall. Results of the study are reported in the histograms below. (In each histogram, the vertical axis shows the number of shoppers in each class or interval.)
Refer to the age histogram in part a of Exercise 77 and complete the sentences below with the proper number. You don’t need to make any detailed calculations. Choose the most “reasonable” answer. a. The mean age of recent customers is approximately i) 18 ii)
Refer to the mall visits histogram in part c of Exercise 77 and complete the sentences below with the proper number. You don’t need to make any detailed calculations. Choose the most “reasonable” answer. a. The mean number of previous mall visits for recent customers is approximately i) 2
For the following set of values, compute the range, the MAD, the variance and the standard deviation. Interpret each of these measures of dispersion. 2, 12, 6, 4, 8, 22
The Japanese yen to US dollar exchange rate over the past seven days has been: 112, 115, 111, 116, 116, 116, 112Compute the range, the MAD, the variance, and the standard deviation or the data. Interpret each of these measures of dispersion.
Below is a list of “bad cholesterol” (LDL) levels for 25 subjects who are about to take part in a clinical test of a new cholesterol medication: 223, 198, 194, 211, 230, 221, 190, 185, 234, 210,189, 193, 198, 178, 209, 231, 186, 203, 182,193, 201, 242, 216, 177, 204a. Determine and interpret
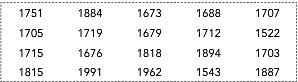
Below is a table showing the number of personal vehicles entering the US from Mexico during 2010 Determine Q1, Q2, and Q3.
The Following table shows recent study times and test scores for a sample of four students in a Managerial Finance class.a. Compute the covariance for study time and test score. b. Compute the correlation coefficient for study time and test score.c. Do the data show a high degree of association
Studies have shown that the number of bars and the number of churches in 20 different cities are highly and positively correlated. Which of the following explanations seems most appropriate? a. The presence of more churches causes an increase in alcohol consumptionb. The presence of more bars
Studies have shown that the price of an egg and the price of a newspaper for the years 1920 to 2004 are highly and positively correlated. Explain what’s going on here.
The following city data shows average temperature (degrees Fahrenheit) and the rate of serious crime (felonies per 10,000 populations) for a sample of five months during the past year.a. Compute the covariance for temperature and crime rate.b. Compute the correlation coefficient for temperature and
Some statisticians have done (semi-serious) studies to connect Super Bowl scores to the performance of the Dow Jones Industrial Average (DJIA). (For example, see summers, P.M.: The Super Bowl Theory: Fourth and Long, College Mathematics Journal 31.) Below is a table showing the total points scored
As part of Beta Industries quality control procedures, inspectors monitor the diameter and the thickness of each micro-battery produced. Below are the results of the last eight measurements:Which characteristic, thickness or diameter, shows the greater variation? Use the coefficient of variation to
The table below shows the length of 10 recent broad-band service interruptions as reported by Broad Cast Cable Services, the largest service provider in the country, and JST Broadband, a smaller regional provider. The standard deviation of each of the data sets is an identical 7.72 minutes. For
The following table summarizes the mean returns and the standard deviations for several types of securities over the time period 1926-2002.a. If standard deviation is used to measure the risk associated with each type of security, rank order the securities from highest to lowest risk. b. If the
Robert Johnson’s sales (in $1000s) over the last 7 months were263, 345, 462, 198, 146, 231, 252Erin Phillips’ sales over this period were 240, 263, 236, 277, 214, 345, 210a. Compute the mean and standard deviation for each set of monthly sales figures.b. Compute the coefficient of
You have $10,000 to invest. You hope to have $15,000 at the end of five years. Use the geometric mean to compute the average rate of return that you will have to earn to reach your goal.
Refer to Exercise 5 (US Oil Production).a. Determine Q1, Q2 and Q3 for the oil production data. b. In which quartile is the year 1974? 1997?
US exports of goods and services grew from $616,455,000,000 in 1992 to $1,831,835,000,000 in 2010. Use the geometric mean to compute the average annual growth rate.
Consumer Electronics reports that over the past eight years domestic sales of flat panel televisions have grown from 61,000 sets to 1,440,000 sets. Use the geometric mean to compute the average annual growth rate for flat-panel television sales.
One technique used in business forecasting calculates a weighted moving average of observations from a fixed number of recent time periods to forecast what will happen next. In such an approach, more recent observations are commonly given a greater weight than older ones. Suppose you are using a
J. Goveia, a long distance bike racer, just rode 24 minutes up one side of Milkrun Hill at 3 mph and 6 minutes down the other side at 50 mph. He mistakenly computes his average speed over that stretch of road as (3 + 50)/2 = 26.5 mph. Apply a weighted average approach—using the minutes at each
By mixing available fuel, you need to produce 3500 gallons of gasoline for your feet of trucks this month. You plan to mix 800 gallons of fuel A (80 octane), 1500 gallons of fuel B (92 octane) and 1200 gallons of fuel C (78 octane). Use the weighted average approach to compute the octane rating for
You intend to devise a weighted average approach to measure and report employee performance. You plan to score each employee in three general areas—technical proficiency, interpersonal skills, and initiative—and want a weighting scheme that will make technical proficiency twice as important as
Refer to Exercise 7 (State Income Tax).a. Determine Q1, Q2 and Q3 for the tax rate data. b. In which quartile is New York? Missouri?
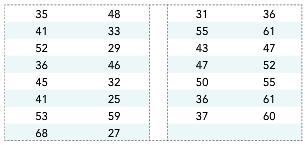
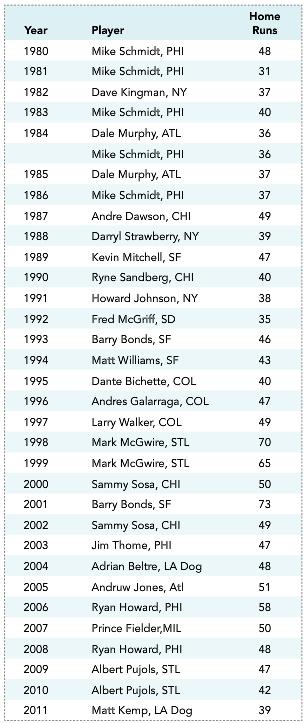
The following table shows the National League home run leaders and their total home runs for the years 1980 to 2011.a. Determine Q1, Q2 and Q3 for the home run data. b. In which quartile is Howard Johnson€™s 1991 home run total? Albert Pujols€™ 2010 total?
The table shows the year-to-date % change in share prices for the 30 companies that make up the Dow Jones Industrial Averagea. Determine Q1, Q2 and Q3 for the price change data. b. In which quartile is Caterpillar Inc.? Coca Cola?
Worker absences for the past year were recorded for the employees in your department. Determine Q1, Q2 and Q3 for the data.
The number of fabricated parts that didn€™t pass inspection was tracked for 25 recent shifts at Cornwall Manufacturing. The data are shown in the table below. Determine Q1, Q2 and Q3 for the data.
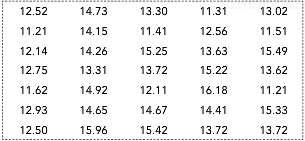
Determine and interpret the inter-quartile range for the data in Exercise 8 showing month’s of useful cell phone life. The unordered list is reproduced below:12.7, 23.5, 26.8, 15.5, 13.6, 28.9, 14.5, 36.0, 27.8,25.2, 35.7, 62.5, 16.2, 35.5, 28.2, 15.6, 32.7, 22.1
The Following table gives the rate of unemployment for the US civilian population for the years 1990 to 2010Determine and interpret the inter-quartile range for the data.
Physical fitness test scores for 26 college sophomores are shown below. Determine and interpret the inter-quartile range for the scores. 124, 141, 132, 111, 115, 135, 152, 121, 132, 125, 119, 123, 98, 140, 127, 132, 108, 122, 135, 141, 120, 118, 163, 121,138, 122
Below is a table showing the number of fights at US airports that were delayed on the tarmac for more than 3 hours before departure during a recent 12-month period Month Delayed Flights March........ 85 April........ 74 May........ 34 June......... 268 July......... 161 August........
Refer to Exercise 7 (State Income Tax). Determine the inter-quartile range for the tax rate data.
According to Apple’s iTunes App Store, 630,210 active applications (apps) were available for download as of May 1, 2012. Below is a table showing monthly submissions of new applications to the App Store from March 2011 through April 2012. Determine the inter-quartile range for the submissions
Refer to Exercise 13 (Home Runs). Determine the inter-quartile range for the data.
Refer to Exercise 14 (Share Price Changes). Determine the inter-quartile range for the price change data.
The data below show the number of cases of pneumonia reported in the state of Maryland during the last 15 months.a. Create a stem-and-leaf diagram to display the data using two leading digits to form the stem. Retain the original order when entering the leaf values.b. Produce an ordered
The data below show the number of major road and highway improvement projects completed in the 20 western states during the past year.a. Create a stem-and-leaf diagram to display the data using two leading digits to form the stem. Use a “leaf unit” of 10 so that you can construct the diagram
Below is a table showing 100-meter finish times (in seconds) for 35 competitors at the NCAA Division III Track and Field Championships recently held in Muncie, Indiana.a. Create a stem-and-leaf diagram to display the data using two leading digits to form the stem. Use a leaf unit of .1. Retain the
The table below shows the prevalence of tobacco smoking among youth, ages 12€“17, by state Construct an ordered stem and leaf diagram to represent the data. Use stems of 6, 7, 8, etc. and a leaf unit of .1.
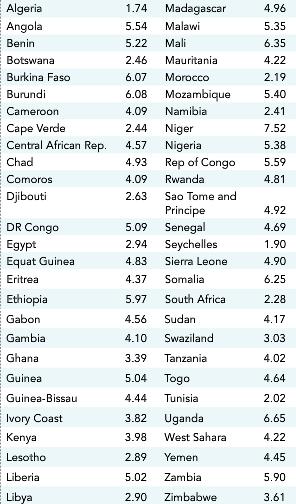
Below is a table of birthrates (births per woman) for the countries of Africa Construct a “stretched” stem and leaf diagram to represent the data. Use stems of 1, 1, 2, 2, 3, 3 etc. and a leaf unit of .1 (which means you will lose the second decimal place).
Refer to Exercise 13 (Home Runs). Construct a €œstretched€ stem and leaf diagram to represent the data. Use stems of 3, 3, 4, 4, etc.
In a recent consumer survey, 18 mall shoppers were asked about the total value of their purchases on the day of the survey. Results are shown below:$110, 256, 23, 45, 168, 122, 135, 56, 18, 0, 44, 68, 120, 115, 456, 256, 174, 88a. Determine and interpret the 40th percentile value. b. Determine and
Refer to Exercise 21 (iTunes Apps). Construct a stem and leaf diagram to represent the data. Use stems of 16, 17, 18, etc. and a leaf unit of 100.Month Submitted
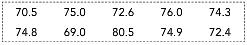
Draw a box plot using the following 5-number summary: Min: 66 Q1: 68 Median: 73 Q3: 78 Max: 80
Draw a box plot using the following 5-number summary: Min: 115 Q1: 124 Median: 131 Q3: 140 Max: 162
The Bureau of Transportation Statistics conducts a monthly household survey. In the October survey, one of the questions was, “For your most recent airline fight originating in the US, what was the total time you waited for security screening?” A summary of the 344 responses is provided in the
The data from Exercise are reproduced in the table below. The table shows last year’s percentage increase in value for each of the 15 stocks in your investment portfolio:Draw the box plot.
The EPA (Environmental Protection Agency) uses an Air Quality Index to measure air quality in cities around the country. Below is a summary of the daily Air Quality Index for Fresno, California, in 2011:Min: 22 Q1: 46 Median: 72 Q3: 119 Max: 200Draw the box plot.
The data for exercise 15 (worker absences) is shown below. Construct the appropriate box plot.
The data for exercise 16 (rejected parts) is shown in the table. Show the box plot for the data.
Refer to exercise 28 (birth rates). Below is the ordered list of the data. Show the box plot.
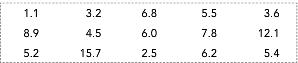
The table shows team goals scored by English Premier League soccer teams in a recent season
The number of service calls made by Zappos’ customer service team over the past 30 days is shown in the table: a. Determine and interpret the 35th percentile value for the service call data.b. Determine and interpret the 60th percentile value.c. Determine and interpret the median value.d.
Describe the differences and similarities in the data sets represented by the two box plots:
The box plots here show claimed expenses on the expense vouchers submitted by 30 members of the marketing department and 40 members of the accounting department last week. Describe the differences and similarities in the data sets represented by the two box plots:
The thickness of lens flters that are precision cut by laser trimmers at Upton Camera’s main manufacturing operation is carefully monitored. Below are the thickness measurements in millimeters for seven recently produced flters.a. Use the “1.5 × inter-quartile range” approach to
The hydrofoil ride from Hong Kong to Macao is one of the great boat rides in the world. The company that runs the shuttle is testing a new boat designed especially for the route. One-way transit times, in minutes, are given below for 10 test runs:a. Construct the box plot and use the “1.5 ×
Below is the table From Exercise 2 showing the number of fights at US airports that were delayed on the tarmac for more than three hours before departure during a recent 12-month periodMonth Delayed
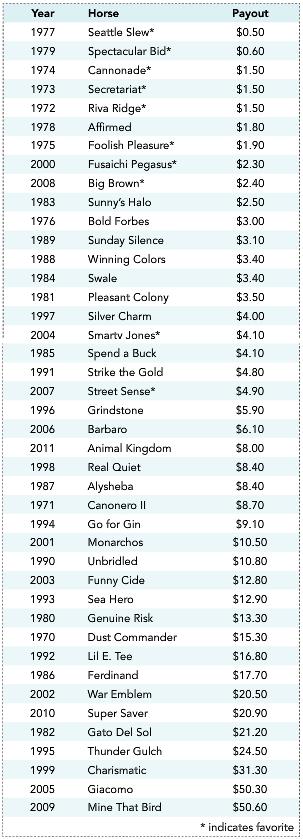
The table shows the smallest to largest winning payout (per $1 wagered) for winners of the Kentucky Derby, 1970–2011a. Draw the box plot for the payout data. Use the “1.5 x inter-quartile range” approach to identify any outliers.b. Use the “3-standard-deviation” approach to identify
Refer to exercise 13 (Home Runs).a. Draw the box plot and use the “1.5 x inter-quartile range” approach to identify any outliers.b. Use the “3-standard-deviation” approach to identify any outliers. (The mean is 46.125; the standard deviation is 9.51.)c. Calculate the z -score for Dale
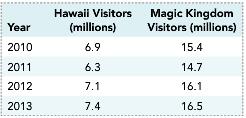
The number of vacationers visiting Hawaii during a four-year period is shown in the table below. Also shown is the estimated number of visitors to Walt Disney’s Magic Kingdom over the same period. Show the scatter diagram. Compute the covariance and interpret the result.
Health and nutrition researchers have studied the possible association between family income and the height of children in the family at various growth stages. Suppose numbers from a recent study of five families showed the following results:Annual Family Income ($000)
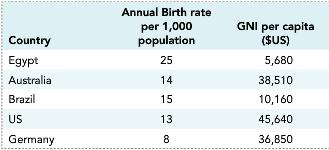
The World Population Data Sheet provides comprehensive data on world population trends. The table below shows birth rates for five selected countries, along with each country’s GNI (Gross National Income) per capita.Show the scatter diagram. Compute and interpret the covariance.
The table below shows US crude oil production, in millions of barrels per day, from 1970 to 2010.a. Determine and interpret the 20th percentile value for the oil production data.b. Determine and interpret the 75th percentile value.c. Determine and interpret the median value.d. What is the
Five auditors participated in an experiment. Each was asked to identify errors or “red flags” in the financial statements of a fictitious company. The time that each of the five took to do the audit and the number of “red flags” properly identified were recorded, with the following
A test is conducted to establish whether there is a connection between RPMs and fuel efficiency for a new engine designed to run on biofuel. The results of the test are shown in the table:RPMs (in 100s) Miles per
The US Forest Service published the following data showing the number of acres of trees (in 000s) harvested in national forests for the past four years and the number of Class 1 forest fires reported on Forest Service land during those years.a. Show the scatter diagram and compute the covariance
End-of-month values for the Dow Jones Industrial Average (DJIA) and the NASDAQ Composite Index, both measures of stock market performance, are given below for the last four sample months.a. Compute the covariance. Remember to treat the data as a sample.b. Compute the correlation coefficient.
The table below shows unemployment rates and government debt ratios (debt/GDP) for four selected countriesa. Compute the covariance.b. Compute the correlation coeffcient and indicate what conclusions can be drawn.
Compute the correlation coefficients for the situations described ina. Exercise 47. Use αx = .402 (Hawaii), αy = .687 (Magic Kingdom).In Exercise 47b. Exercise 48. Use αx = 17.74 (Income), αy = 1.14 (Height).In Exercise 48Annual Family Income ($000)
Are average download prices for music and the volume of illegal music downloads related? Below is a table showing the average download price per song and the estimated percentage of music downloads that were illegal for a 4-year period.a. Compute the covariance. b. Compute the correlation
Below is a table of average gold prices for each of six years, along with annual sales of prospecting equipment in Fairbanks, Alaska.a. Compute the covariance.b. Compute the correlation coefficient and indicate what conclusions can be drawn.
Values for the monthly Consumer Price Index (CPI) over the past six months were: 127, 121, 115, 118, 123, 126Values for the Index of Leading Economic Indicators (ILEI) over the same period are shown below:112, 113, 118, 110, 113, 114The standard deviation for the CPI data is 4.23. The standard
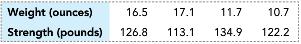
Quality control inspectors monitor two primary characteristics of the units being manufactured in the company’s main factory: weight and breaking strength. Below is a sample of four recent readings for weight (in ounces) and breaking strength (in pounds).a. Compute the standard deviation for each
Midterm exam scores for your Entrepreneurial Management class are shown in the table:a. Determine and interpret the 80th percentile value for the exam scores data.b. Determine and interpret the 45th percentile value.c. Determine and interpret the median value. d. What is the percentile for a score
The Bureau of Labor Statistics reports the following labor costs per hour in each of four countries for a four-year period. Use the coefficient of variation to compare the degree of variation in labor costs among the four countries during this period. According to your calculation, which country
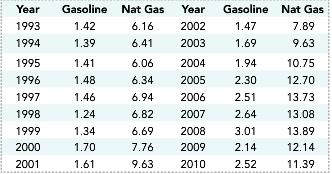
The table shows gasoline prices ($/gallon) and natural gas prices ($/1000 cu ft, residential) for the years 1993-2010a. Compute the coefficient of variation for each data set. (Gasoline σ = .52; natural gas σ = 2.81)b. As measured by the coefficient of variation, which data set shows the greater
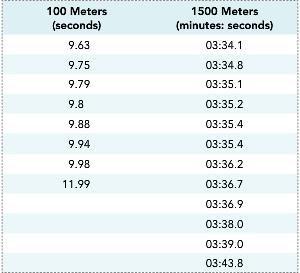
Below are the finish times for the finalists in the men’s 100-meter and the 1500-meter races at the 2012 Olympic Gamesa. Compute the coefficient of variation for each data set. (100 meters σ2 = .524; 1500 meters σ2 = 6.284)b. As measured by the coefficient of variation, which data set shows the
According to a US Energy Information Administration report, the US increased its petroleum imports from Brazil from 1.8 million barrels in 1997 to 99.3 million barrels in 2010. Use the geometric mean to compute the average annual rate of increase during this period.
Your company’s advertising budget grew from $3.72 million four years ago to $5.14 million this year. What was the average annual growth rate for the budget over this four-year period? Use the geometric mean as the proper measure.
Showing 21000 - 21100
of 88243
First
204
205
206
207
208
209
210
211
212
213
214
215
216
217
218
Last
Step by Step Answers

.png)
.png)
.png)
.png)
.png)
.png)
.png)
.png)
.png)
.png)
.png)
.png)
.png)
.png)
.png)
.png)
.png)
.png)
.png)
.png)
.png)
.png)
.png)
.png)
.png)
.png)
.png)
.png)
.png)
.png)
.png)
.png)
.png)
.png)
.png)


.png)
.png)
.png)
.png)