New Semester
Started
Get
50% OFF
Study Help!
--h --m --s
Claim Now
Question Answers
Textbooks
Find textbooks, questions and answers
Oops, something went wrong!
Change your search query and then try again
S
Books
FREE
Study Help
Expert Questions
Accounting
General Management
Mathematics
Finance
Organizational Behaviour
Law
Physics
Operating System
Management Leadership
Sociology
Programming
Marketing
Database
Computer Network
Economics
Textbooks Solutions
Accounting
Managerial Accounting
Management Leadership
Cost Accounting
Statistics
Business Law
Corporate Finance
Finance
Economics
Auditing
Tutors
Online Tutors
Find a Tutor
Hire a Tutor
Become a Tutor
AI Tutor
AI Study Planner
NEW
Sell Books
Search
Search
Sign In
Register
study help
mathematics
statistics
Business Statistics A First Course 7th Edition David M. Levine, Kathryn A. Szabat, David F. Stephan - Solutions
How have stocks performed in the past? The following table presents the data stored in Stock Performance and shows the performance of a broad measure of stocks (by percentage) for each decade from the 1830s through the 2000s:a. Construct a time series plot of the stock performance from the 1830s to
The data in New Home Sales represent number and median sales price of new single family houses sold in the United States recorded at the end of each month from January 2000 through December 2013. (Data extracted from www. census. gov, February 28, 2014.) a. Construct a time series plot of new
The file Movie Attendance contains the yearly movie attendance (in billions) from 2001 through 2013:a. Construct a time series plot for the movie attendance (in billions). b. What pattern, if any, is present in the data?
The file Audits contains the number of audits of corporations with assets of more than $ 250 million conducted by the Internal Revenue Service between 2001 and 2013. (Data extracted from www. irs. gov.) a. Construct a time series plot. b. What pattern, if any, is present in the data?
Using the sample of retirement funds stored in Retirement Funds:a. Construct a table that tallies type, market cap, and rating.b. What conclusions can you reach concerning differences among the types of retirement funds (growth and value), based on market cap (small, mid cap, and large) and the
Using the sample of retirement funds stored in Retirement Funds:a. Construct a table that tallies market cap, risk, and rating.b. What conclusions can you reach concerning differences among the funds based on market cap (small, mid cap, and large), risk (low, average, and high), and the rating
The following table represents world oil production in millions of barrels a day in 2013:a. Compute the percentage of values in each category.b. What conclusions can you reach concerning the production of oil in 2013?
Using the sample of retirement funds stored in Retirement Funds:a. Construct a table that tallies type, risk, and rating.b. What conclusions can you reach concerning differences among the types of retirement funds (growth and value), based on the risk (low, average, and high), and the rating (one,
Using the sample of retirement funds stored in Retirement Funds:a. Construct a table that tallies type, market cap, risk, and rating.b. What conclusions can you reach concerning differences among the types of funds based on market cap (small, mid cap, and large), based on type (growth and value),
The value of a National Basketball Association (NBA) franchise has increased dramatically over the past few years. The value of a franchise varies based on the size of the city in which the team is located, the amount of revenue it receives, and the success of the team. The file NBA Values contains
The annual ranking of the FT Global 500 2013 provides a snapshot of the world’s largest companies. The companies are ranked by market capitalization— the greater the stock market value of a company, the higher the ranking. The market capitalizations (in $ billions) and the 52 week change in
Your task as a member of the International Strategic Management Team in your company is to investigate the potential for entry into a foreign market. As part of your initial investigation, you must provide an assessment of the economies of countries in the Americas and the Asia and Pacific regions.
Sales of automobiles in the United States fluctuate from month to month and year to year. The file AutoSales contains the sales for various automakers in July 2013 and the percentage change from June 2013 sales. (Data extracted from “How the Auto Industry Fared in July,”nyti. ms/ 1nnlCV2.) a.
Using the sample of retirement funds stored in Retirement Funds:a. Construct a table that tallies type, market cap, and rating. b. Drill down to examine the large cap growth funds with a rating of three. How many funds are there? What conclusions can you reach about these funds?
Using the sample of retirement funds stored in Retirement Funds : a. Construct a table that tallies market cap, risk, and rating. b. Drill down to examine the large cap funds that are high risk with a rating of three. How many funds are there? What conclusions can you reach about these funds?
Using the sample of retirement funds stored in Retirement Funds : a. Construct a table that tallies type, risk, and rating. b. Drill down to examine the growth funds with high risk with a rating of three. How many funds are there? What conclusions can you reach about these funds?
Using the sample of retirement funds stored in Retirement Funds:a. Construct a table that tallies type, market cap, and risk. b. Drill down to examine the large cap growth funds with high risk. How many funds are there? What conclusions can you reach about these funds?
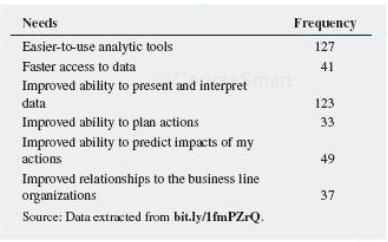
Vizier’s Survey of Employers explores how North American organizations are solving the challenges of delivering work-force analytics. Employers were asked what would help them be successful with human resources metrics and reports. The responses (stored in Needs) were as follows:a. Compute the
Examine the following visualization, adapted from one that appeared in a post in a digital marketing blog.a. Describe at least one good feature of this visual display. b. Describe at least one bad feature of this visual display. c. Redraw the graph, using the guidelines above.
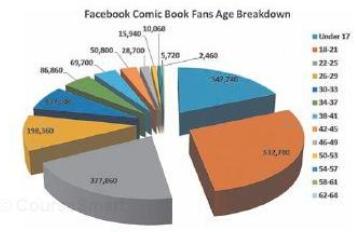
Examine the following visualization, adapted from one that appeared in the post “Who Are the Comic Book Fans on Facebook?”on February 2, 2013, as reported by graphicspolicy.com.a. Describe at least one good feature of this visual display.b. Describe at least one bad feature of this visual
Examine the following visualization, adapted from a management consulting white paper.a. Describe at least one good feature of this visual display. b. Describe at least one bad feature of this visual display. c. Redraw the graph, using the guidelines given on page 70.
Figure 2.1 shows a bar chart and a pie chart for the main reason young adults shop online.a. Create an exploded pie chart, a doughnut chart, a cone chart, or a pyramid chart that shows the main reason young adults shop online.b. Which graphs do you prefer— the bar chart or pie chart or the
Figures 2.2 and 2.3 show a bar chart and a pie chart for the risk level for the retirement fund data.a. Create an exploded pie chart, a doughnut chart, a cone chart, and a pyramid chart that shows the risk level of retirement funds.b. Which graphs do you prefer— the bar chart or pie chart or the
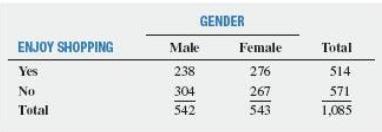
A survey of 1,085 adults asked “Do you enjoy shopping for clothing for yourself?” The results indicated that 51% of the females enjoyed shopping for clothing for themselves as compared to 44% of the males. (Data extracted from “Split Decision on Clothes Shopping,” USA Today, January 28,
What are the advantages and disadvantages of using a bar chart, a pie chart, and a Pareto chart?
Compare and contrast the bar chart for categorical data with the histogram for numerical data.
The following summary, table, presents the breakdown of the price of a new college textbook:a. Using the four categories of publisher, bookstore, author, and freight, construct a bar chart, a pie chart, and a Pareto chart. b. Using the four subcategories of publisher and three subcategories of
The following table represents the market share (in number of movies, gross in millions of dollars, and millions of tickets sold) of each type of movie in 2013:a. Construct a bar chart, a pie chart, and a Pareto chart for the number of movies, gross (in $ millions), and number of tickets sold (in
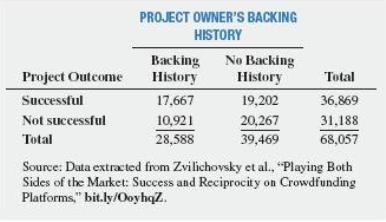
A study of Kickstarter projects showed that 54.2% were successful, that is, achieved its goal and raised at least the targeted goal amount. In an effort to identify network dynamics that influences success, projects were subdivided into projects of owners who had backed other projects before,
A survey was completed by senior level marketers on marketer expectations and perspectives going into the next year for such things as marketing spending levels, media usage, and new business activities. Marketers were asked about how they are most often finding out about new marketing agencies for
The owner of a restaurant that serves Continental style entrées has the business objective of learning more about the patterns of patron demand during the Friday to Sunday weekend time period. Data were collected from 630 customers on the type of entrée ordered and organized in the following
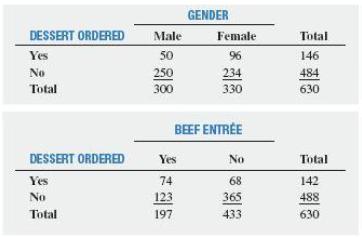
Suppose that the owner of the restaurant in Problem 2.91 also wants to study the demand for dessert during the same time period. She decides that in addition to studying whether a dessert was ordered, she will also study the gender of the individual and whether a beef entrée was ordered. Data were
The following data represent the pounds per capita of fresh food and packaged food consumed in the United States, Japan, and Russia in a recent year:a. For the United States, Japan, and Russia, construct a bar chart, a pie chart, and a Pareto chart for different types of fresh foods
The Air Travel Consumer Report, a monthly product of the Department of Transportation€™s Office of Aviation Enforcement and Proceedings (OAEP), is designed to assist consumers with information on the quality of services provided by airlines. The report includes a summary of consumer
The file Domestic Beer contains the percentage alcohol, number of calories per 12 ounces, and number of carbohydrates (in grams) per 12 ounces for 156 of the best selling domestic beers in the United States. Source: Data extracted from www. beer100. com/ beercalories.htm, March 12, 2014. a.
The file Cigarette Tax contains the state cigarette tax ($) for each state as of January 1, 2014. a. Construct an ordered array. b. Plot a percentage histogram. c. What conclusions can you reach about the differences in the state cigarette tax between the states?
The file CD Rate contains the yields for one year certificates of deposit (CDs) and a five year CDs for 22 banks in the United States, as of March 12, 2014. Source: Data extracted and compiled from www. Bankrate. com, March 12, 2014. a. Construct a stem and leaf display for one year CDs and
The file CEO Compensation includes the total compensation (in $ millions) for CEOs of 170 large public companies and the investment return in 2012. (Data extracted from “CEO Pay Skyrockets as Economy, Stocks Recover, ”USA Today, March 27, 2013, p. B1.) For total compensation:a. Construct a
The following set of data is from a sample of n = 5:7 4 9 8 2a. Compute the mean, median, and mode.b. Compute the range, variance, standard deviation, and coefficient of variation.c. Compute the Z scores. Are there any outliers?d. Describe the shape of the data set.
The file SUV contains the overall miles per gallon (MPG) of 2014 small SUVs.a. Compute the mean, median, and mode.b. Compute the variance, standard deviation, range, coefficient of variation, and Z scores.c. Are the data skewed? If so, how?d. Compare the results of (a) through (c) to those of
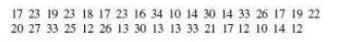
The file Accounting Partners contains the number of partners in a cohort of rising accounting firms that have been tagged as €œfirms to watch.€ The firms have the following numbers of partners.a. Compute the mean, median, and mode.b. Compute the variance, standard deviation, range,
The file Market Penetration contains Facebook penetration values (the percentage of the country population who are Face-book users) for 22 of the world’s largesta. Compute the mean, median, and mode.b. Compute the variance, standard deviation, range, coefficient of variation, and Z scores. Are
Is there a difference in the variation of the yields of different types of investments? The file CD Rate contains the yields for one- year certificates of deposit (CDs) and five- year CDs for 22 banks in the United States, as of March 12, 2014. Source: Data extracted from www.Bankrate.com, March
The file Hotel Away contains the average room price (in (US$) paid by various nationalities while traveling abroad (away from their home country) in 2013:a. Compute the mean, median, and mode.b. Compute the range, variance, and standard deviation.c. Based on the results of (a) and (b), what
A bank branch located in a commercial district of a city has the business objective of developing an improved process for serving customers during the noon- to- 1: 00 p. m. lunch period. The waiting time, in minutes, is defined as the time the customer enters the line to when he or she reaches
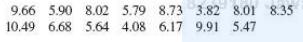
Suppose that another bank branch, located in a residential area, is also concerned with the noon- to- 1: 00 p. m. lunch hour. The waiting time, in minutes, collected from a sample of 15 customers during this hour, are stored in Bank2 : 9.66 5.90a. Compute the mean and median.b. Compute the
Using the one- year return percentage variable in Retirement Funds:a. Construct a table that computes the mean for each combination of type, market cap, and risk.b. Construct a table that computes the standard deviation for each combination of type, market cap, and risk. c. What conclusions can you
Using the one- year return percentage variable in Retirement Funds:a. Construct a table that computes the mean for each combination of type, market cap, and rating.b. Construct a table that computes the standard deviation for each combination of type, market cap, and rating.c. What conclusions can
Using the one- year return percentage variable in Retirement Funds:a. Construct a table that computes the mean for each combination of market cap, risk, and rating.b. Construct a table that computes the standard deviation for each combination of market cap, risk, and rating.c. What conclusions can
The following set of data is from a sample of n = 6:7 4 9 7 3 12a. Compute the mean, median, and mode.b. Compute the range, variance, standard deviation, and coefficient of variation.c. Compute the Z scores. Are there any outliers?d. Describe the shape of the data set.
Using the one- year return percentage variable in Retirement Funds:a. Construct a table that computes the mean for each combination of type, risk, and rating.b. Construct a table that computes the standard deviation for each combination of type, risk, and rating.c. What conclusions can you reach
The following is a set of data from a sample of n = 7:12 7 4 9 0 7 3a. Compute the first quartile (Q1), the third quartile (Q3), and the interquartile range.b. List the five- number summary.c. Construct a boxplot and describe its shape.d. Compare your answer in (c) with that from Problem 3.3 ( d)
The following is a set of data from a sample of n = 6:7 4 9 7 3 12a. Compute the first quartile (Q1), the third quartile (Q3), and the interquartile range.b. List the five- number summary.c. Construct a boxplot and describe its shape.d. Compare your answer in (c) with that from Problem 3.2 (d) on
The following is a set of data from a sample of n = 5: 7 4 9 8 2 a. Compute the first quartile (Q1), the third quartile (Q3), and the interquartile range. b. List the five- number summary. c. Construct a boxplot and describe its shape. d. Compare your answer in (c) with that from Problem 3.1 (d) on
The following is a set of data from a sample of n = 5: 7 - 5 - 8 7 9 a. Compute the first quartile (Q1), the third quartile (Q3), and the interquartile range. b. List the five- number summary. c. Construct a boxplot and describe its shape. d. Compare your answer in (c) with that from Problem 3.4
The file accounting partners contains the number of partners in a cohort of rising accounting firms that have a tagged as €œfirms to watch€™ The firms have the following numbers of partners:a. Compute the first quartile (Q1), the third quartile (Q3), and the interquartile
The file Market Penetration contains Facebook penetration values (the percentage of the country population that are Facebook users) for 22 of the world€™s largest economies:a. Compute the first quartile (Q1), the third quartile (Q3), and the interquartile range. b. List the five- number
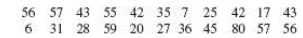
The file HotelAway contains the average room price ( in US$) paid by various nationalities while traveling abroad ( away from their home country) in 2013:179 173 175 173 164 143 153 155a. Compute the first quartile (Q1), the third quartile (Q3), and the interquartile range.b. List the five- number
The file SUV contains the overall MPG of 2014 small SUVs:a. Compute the first quartile (Q1), the third quartile (Q3), and the interquartile range. b. List the five- number summary. c. Construct a boxplot and describe its shape.
The file CD Rate contains the yields for one- year CDs and five-year CDs, for 22 banks in the United States, as of March 12, 2014. Source: Data extracted from www. Bankrate.com, March 12, 2014.For each type of account:a. Compute the first quartile (Q1), the third quartile (Q3), and the
The following set of data is from a sample of n = 7:12 7 4 9 0 7 3a. Compute the mean, median, and mode.b. Compute the range, variance, standard deviation, and coefficient of variation.c. Compute the Z scores. Are there any outliers?d. Describe the shape of the data set.
A bank branch located in a commercial district of a city has the business objective of developing an improved process for serving customers during the noon- to- 1: 00 p. m. lunch period. The waiting time, in minutes, is defined as the time the customer enters the line to when he or she reaches the
The file RadioShack contains the number of RadioShack stores located in each of the 50 U. S. states and the District of Columbia, as of December 31, 2013:a. Compute the mean, variance, and standard deviation for this population.b. What percentage of the 50 states have RadioShack stores within ± 1,
Consider a population of 1,024 mutual funds that primarily invest in large companies. You have determined that m, the mean one- year total percentage return achieved by all the funds, is 8.20 and that s, the standard deviation, is 2.75. a. According to the empirical rule, what percentage of these
The file Cigarette Tax contains the state cigarette tax (in $) for each of the 50 states as of January 1, 2014. a. Compute the population mean and population standard deviation for the state cigarette tax. b. Interpret the parameters in (a).
The file Energy contains the per capita energy consumption, in kilowatt- hours, for each of the 50 states and the District of Columbia during a recent year.a. Compute the mean, variance, and standard deviation for the population.b. What proportion of these states has per capita energy consumption
Thirty companies comprise the DJIA. Just how big are these companies? One common method for measuring the size of a company is to use its market capitalization, which is computed by multiplying the number of stock shares by the price of a share of stock. On March 14, 2014, the market capitalization
The following is a set of data from a sample of n = 11 items:a. Compute the covariance. b. Compute the coefficient of correlation. c. How strong is the relationship between X and Y? Explain.
A study of 483 first- year college women suggests a link between media usage such as texting, chatting on cell phones, and posting status updates on Facebook, and grade point average. Students reporting a higher use of media had lower grade point aver-ages than students reporting a lower use of
The following set of data is from a sample of n = 5:7 - 5 - 8 7 9a. Compute the mean, median, and mode.b. Compute the range, variance, standard deviation, and coefficient of variation.c. Compute the Z scores. Are there any outliers?d. Describe the shape of the data set.
The file Cereals lists the calories and sugar, in grams, in one serving of seven breakfast cereals:a. Compute the covariance.b. Compute the coefficient of correlation.c. Which do you think is more valuable in expressing the relation-ship between calories and sugar€” the covariance or the
Movie companies need to predict the gross receipts of individual movies once a movie has debuted. The data, shown in the next column and stored in Potter Movies , are the first weekend gross, the U. S. gross, and the worldwide gross ( in $ millions) of the eight Harry Potter movies:a. Compute the
College football is big business, with coaches’ total pay and revenues, in millions of dollars. The file College Football contains the coaches’ pay and revenues for college football at 105 of the 124 schools that are part of the Division I Football Bowl Subdivision. Source: Data extracted
A Pew Research Center survey found that social net-working is popular in many nations around the world. The file Global Social Media contains the level of social media networking (measured as the percentage of individuals polled who use social networking sites) and the GDP at purchasing power
What are the differences among the mean, median, and mode, and what are the advantages and disadvantages of each?
How do you interpret the first quartile, median, and third quartile?
What are the differences among the various measures of variation, such as the range, interquartile range, variance, standard deviation, and coefficient of variation, and what are the advantages and disadvantages of each?
How do the empirical rule and the Chebyshev rule differ?
What is the difference between skewness and kurtosis?
How do the covariance and the coefficient of correlation differ?
The American Society for Quality (ASQ) conducted a salary survey of all its members. ASQ members work in all areas of manufacturing and service- related institutions, with a common theme of an interest in quality. Manager and quality engineer were the most frequently reported job titles among the
In certain states, savings banks are permitted to sell life insurance. The approval process consists of underwriting, which includes a review of the application, a medical information bureau check, possible requests for additional medical information and medical exams, and a policy compilation
The operations manager of a plant that manufactures tires wants to compare the actual inner diameters of two grades of tires, each of which is expected to be 575 millimeters. A sample of five tires of each grade was selected, and the results representing the inner diameters of the tires, ranked
A manufacturing company produces steel housings for electrical equipment. The main component part of the housing is a steel trough that is made of a 14- gauge steel coil. It is produced using a 250- ton progressive punch press with a wipe- down operation and two 90- degree forms placed in the flat
The manufacturing company in Problem 3.60 also produces electric insulators. If the insulators break when in use, a short circuit is likely to occur. To test the strength of the insulators, destructive testing is carried out to determine how much force is required to break the insulators. Force is
Data were collected on the typical cost of dining at American-cuisine restaurants within a 1- mile walking distance of a hotel located in a large city. The file Bundle contains the typical cost (a per transaction cost in $) as well as a Bundle score, a measure of overall popularity and customer
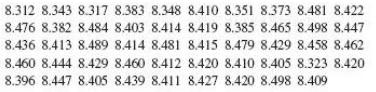
A quality characteristic of interest for a tea bag filling process is the weight of the tea in the individual bags. If the bags are under filled, two problems arise. First, customers may not be able to brew the tea to be as strong as they wish. Second, the company may be in violation of the truth-
The manufacturer of Boston and Vermont asphalt shingles provides its customers with a 20- year warranty on most of its products. To determine whether a shingle will last as long as the warranty period, accelerated- life testing is conducted at the manufacturing plant. Accelerated- life testing
The file Restaurants contains the cost per meal and the ratings of 50 city and 50 suburban restaurants on their food, décor, and service (and their summated ratings). (Data extracted from Zagat Survey 2013 New York City Restaurants and Zagat Survey 2012– 2013 Long Island Restaurants.) Complete
The file Protein contains calories, protein, and cholesterol of popular protein foods (fresh red meats, poultry, and fish). Source: U. S. Department of Agriculture.a. Compute the correlation coefficient between calories and protein.b. Compute the correlation coefficient between calories and
The file Hotel Prices contains the prices in British pounds (about US$ 1.52 as of July 2013) of a room at two-star, three-star, and four-star hotels in cities around the world in 2013. (Data extracted from press.hotels.com/content/blogs.dir/13
The file Property Taxes contains the property taxes per capita for the 50 states and the District of Columbia.a. Compute the mean, median, first quartile, and third quartile.b. Compute the range, interquartile range, variance, standard deviation, and coefficient of variation.c. Construct a boxplot.
Have you wondered how Internet download speed varies around the globe? The file Download Speed contains the mean download speed Mbps for various countries. (Data extracted from www.netindex.com/download/allcountries/.)a. Compute the mean, median, first quartile, and third quartile.b. Compute the
According to the U. S. Census Bureau (census. gov), in 2013, the median sales price of new houses was $ 265,900 and the mean sales price was $ 322,100. a. Interpret the median sales price. b. Interpret the mean sales price. c. Discuss the shape of the distribution of the price of new houses.
311 is Chicago’s web and phone portal for government in-formation and nonemergency services. 311 serves as a comprehensive one- stop shop for residents, visitors, and business owners; therefore, it is critical that 311 representatives answer calls and respond to requests in a timely and accurate
How much time do Americans living in or near cities spend waiting in traffic, and how much does waiting in traffic cost them per year? The file Congestion includes this cost for 31 cities. For the time Americans living in or near cities spend waiting in traffic and the cost of waiting in traffic
How do the average credit scores of people living in various American cities differ? The file Credit Scores is an ordered array of the average credit scores of people living in 143 American cities. (Data extracted from usat.ly/17a1fA6)a. Compute the mean, median, first quartile, and third
The file Domestic Beer contains the percentage alcohol, number of calories per 12 ounces, and number of carbohydrates (in grams) per 12 ounces for 156 of the best- selling domestic beers in the United States. (Data extracted from bit.ly/17H3Ct, March 12, 2014.) Write a report that includes a
The file Mobile Loyalty contains spending on products ($) during a three- month period by a sample of 15 customers receiving incentives through a mobile loyaltya. Compute the mean and median.b. Compute the variance, standard deviation, range, and coefficient of variation.c. Are the data skewed? If
The file Sedans contains the overall miles per gallon (MPG) of 2014 midsized sedans:a. Compute the mean, median, and mode.b. Compute the variance, standard deviation, range, coefficient of variation, and Z scores.c. Are the data skewed? If so, how?d. Compare the results of (a) through (c) to those
Showing 21800 - 21900
of 88243
First
212
213
214
215
216
217
218
219
220
221
222
223
224
225
226
Last
Step by Step Answers
.png)
.png)
.png)
.png)
.png)
.png)
.png)
-1.png)
-2.png)
.png)
-1.png)
-2.png)

.png)
.png)
.png)
.png)
.png)
-2.png)

