New Semester
Started
Get
50% OFF
Study Help!
--h --m --s
Claim Now
Question Answers
Textbooks
Find textbooks, questions and answers
Oops, something went wrong!
Change your search query and then try again
S
Books
FREE
Study Help
Expert Questions
Accounting
General Management
Mathematics
Finance
Organizational Behaviour
Law
Physics
Operating System
Management Leadership
Sociology
Programming
Marketing
Database
Computer Network
Economics
Textbooks Solutions
Accounting
Managerial Accounting
Management Leadership
Cost Accounting
Statistics
Business Law
Corporate Finance
Finance
Economics
Auditing
Tutors
Online Tutors
Find a Tutor
Hire a Tutor
Become a Tutor
AI Tutor
AI Study Planner
NEW
Sell Books
Search
Search
Sign In
Register
study help
mathematics
statistics
Stats Data And Models 4th Edition Richard D. De Veaux, Paul D. Velleman, David E. Bock - Solutions
Look again at Exercise 25's regression output for the calorie and sodium content of hot dogs.In Exercise 25a) The output reports s = 59.66. Explain what that means in this context. b) What's the value of the standard error of the slope of the regression line? c) Explain what that means in this
Look again at Exercise 26's regression output for age and cholesterol level.In Exercise 26a) The output reports s = 46.16. Explain what that means in this context. b) What's the value of the standard error of the slope of the regression line? c) Explain what that means in this context.
Based on the regression output seen in Exercise 25, create a 95% confidence interval for the slope of the regression line and interpret your interval in context.In Exercise 25
Using the regression output in Exercise 1, identifies the error standard deviation and explain what it means in the context of the problemIn Exercise 1
Based on the regression output seen in Exercise 26, create a 95% confidence interval for the slope of the regression line and interpret it in context.In Exercise 26
The scatter plot suggests a decrease in the difference in ages at first marriage for men and women since 1975. We want to examine the regression to see if this decrease is significant.Response variable is Men-Women R-squared = 51.9% s = 0.2143 with 37 - 2 = 35 degrees of freedom a) Write
Vehix.com offered several used Toyota Corollas for sale. Listed below are the ages of the cars and the advertised prices.a) Make a scatterplot for these data. b) Do you think a linear model is appropriate? Explain. c) Find the equation of the regression line. d) Check the residuals to see if the
Based on the analysis of marriage ages since 1975 given in Exercise 31, find a 95% confidence interval for the rate at which the age gap is closing. Explain what your confidence interval means.In Exercise 31
Based on the analysis of used car prices you did for Exercise 32, create a 95% confidence interval for the slope of the regression line and explain what your interval means in context.In Exercise 32
A consumer organization has reported test data for 50 car models. We will examine the association between the weight of the car (in thousands of pounds) and the fuel efficiency (in miles per gallon). Here are the scatter plot, summary statistics, and regression analysis:Dependent variable is
How strong was the association between student scores on the Math and Verbal sections of the old SAT? Scores on each ranged from 200 to 800 and were widely used by college admissions offices. Here are summaries and plots of the scores for a graduating class at Ithaca High School:Dependent variable
Consider again the data in Exercise 35 about the gas mileage and weights of cars.In Exercise 35a) Create a 95% confidence interval for the slope of the regression line. b) Explain in this context what your confidence interval means.
Consider the high school SAT scores data from Exercise 36.In Exercise 36a) Find a 90% confidence interval for the slope of the true line describing the association between Math and Verbal scores. b) Explain in this context what your confidence interval means
Consider again the data in Exercise 35 about the gas mileage and weights of cars.In Exercise 35a) Create a 95% confidence interval for the average fuel efficiency among cars weighing 2500 pounds, and explain what your interval means. b) Create a 95% prediction interval for the gas mileage you might
Using the regression output from Exercise 2 identifies the error standard deviation and explains its meaning with a sentence in contextIn Exercise 2
Consider the high school SAT scores data from Exercise 36 once more.In Exercise 36a) Find a 90% confidence interval for the mean SAT-Math score for all students with an SAT-Verbal score of 500. b) Find a 90% prediction interval for the Math score of the senior class president if you know she scored
A healthy cereal should be low in both calories and sodium. Data for 77 cereals were examined and judged acceptable for inference. The 77 cereals had between 50 and 160 calories per serving and between 0 and 320 mg of sodium per serving. Here's the regression analysis:a) Is there an association
Does your IQ depend on the size of your brain? A group of female college students took a test that measured their verbal IQs and also underwent an MRI scan to measure the size of their brains (in 1000s of pixels). The scatter plot and regression analysis are shown, and the assumptions for inference
Further analysis of the data for the breakfast cereals in Exercise 41 looked for associations between Fiber content and Calories by attempting to construct a linear model. Here are several graphs. Which of the assumptions for inference are violated? Explain.In Exercise 41
Winter The output shows an attempt to model the association between average January Temperature (in degrees Fahrenheit) and Latitude (in degrees north of the equator) for 59 U.S. cities. Which of the assumptions for inference do you think are violated? Explain.
Biologists studying the effects of acid rain on wildlife collected data from 172 streams in the Adirondack Mountains. They recorded the pH (acidity) of the water and the BCI, a measure of biological diversity. Here's a scatter plot of BCI against pH for the 163 streams for which we have these
Data collected from around the globe show that the earth is getting warmer. The most common theory relates climate change to an increase in atmospheric levels of carbon dioxide (C02), a greenhouse gas. The mean annual CO2 concentration in the atmosphere (parts per million) is measured at the top of
The Environmental Protection Agency is examining the relationship between the ozone level (in parts per million) and the population (in millions) of U.S. cities. Part of the regression analysis is shown. Dependent variable is Ozone R-squared = 84.4% s = 5.454 with 16 - 2 = 14 df Variable
A business analyst was interested in the relationship between a company's sales and its profits. She collected data (in millions of dollars) from a random sample of Fortune 500 companies and created the regression analysis and summary statistics shown. The assumptions for regression inference
Consider again the relationship between the population and ozone level of U.S. cities that you analyzed in Exercise 47.In Exercise 47a) Give a 90% confidence interval for the approximate increase in ozone level associated with each additional million city inhabitants. b) For the cities studied, the
Continuing with the regression of Exercise 1, write a sentence that explains the meaning of the standard error of the slope of the regression line, SE (b1) = 0.0240.
Consider again the relationship between the sales and profits of Fortune 500 companies that you analyzed in Exercise 48.In Exercise 48a) Find a 95% confidence interval for the slope of the regression line. Interpret your interval in context. b) Last year, the drug manufacturer Eli Lilly, Inc.,
Cnet.com tests tablet computers and continuously updates its list. As of January 2014, the list included the battery life (in hours) and luminous intensity (i.e., screen brightness, in cd/m2). We want to know if brighter screens are related to the maximum Screen Brightness,
Researchers at the University of Denver Infant Study Center wondered whether temperature might influence the age at which babies learn to crawl. Perhaps the extra clothing that babies wear in cold weather would restrict movement and delay the age at which they started crawling. Data were collected
Do the data shown in the table below indicate an association between Waist size and % Body Fail.a) Test an appropriate hypothesis and state your conclusion.b) Give a 95% confidence interval for the mean % Body Fat found in people with a 40-inch Waist.
Use the data from Exercise 53 to examine the association between Weight and %Body Fat.In Exercise 53a) Find a 90% confidence interval for the slope of the regression line of % Body Fat on Weight. b) Interpret your interval in context. c) Give a 95% prediction interval for the % Body Fat of an
The data set below shows midterm scores from an Introductory Statistics course.a) Fit a model predicting the second midterm score from the first. b) Comment on the model you found, including a discussion of the assumptions and conditions for regression. Is the coefficient for the slope
The professor teaching the Introductory Statistics class discussed in Exercise 55 wonders whether performance on homework can accurately predict midterm scores.In Exercise 55a) To investigate it, she fits a regression of the sum of the two midterm€™s scores on homework scores. Fit the
Remember the Little League instructional video discussed in Chapter 23? Ads claimed it would improve the performances of Little League pitchers. To test this claim, 20 Little Leaguers threw 50 pitches each, and we recorded the number of strikes. After the players participated in the training
All the efficiency money can buy 2011 A sample of 84 model-2011 cars from an online information service was examined to see how fuel efficiency (as highway mpg) relates to the cost (Manufacturer's Suggested Retail Price in dollars) of cars. Here are displays and computer output:a) State what you
The following software output is based on the mortality rate (deaths per 100,000 people) and the education level (average number of years in school) for 58 U.S. cities.Dependent variable is Mortality R-squared = 41.0% s = 47.92 with 58 - 2 = 56 degrees of freedom a) Comment on the assumptions for
Returning to the results of Exercise 2, write a sentence to explain the meaning of the standard error of the slope of the regression line, SE (b1) = 0.0053.
The following software outputs provide information about the Size (in square feet) of 18 homes in Ithaca, New York, and the city's assessed Value of those homes.Dependent variable is Value R-squared = 32.5% s = 4682 with 18 - 2 = 16 degrees of freedom a) Explain why inference for linear regression
Are so-called "right-to-work" laws related to the percent of public sector employees in unions and the percent of private sector employees in unions? This data set looks at these percentages for the states in the United States in 1982. The dependent variable is whether the state had a right-to-work
Are there fundamental differences between liberal arts colleges and universities? In this case, we have information on the top 25 liberal arts colleges and the top 25 universities in the Unites States. We will consider the type of school as our response variable and will use the percent of students
The college administrators in Exercise 1 tested the hypotheses H0: (1 = 0 vs. HA: (1 ≠ 0 and rejected the null hypothesis because the P-value was less than 0.0001. What can they conclude about the relationship between admission rates and graduation rates?
What can the hockey coach in Exercise 2 conclude about shooting and scoring goals from the fact that the P-value < 0.0001 for the slope of the regression line? Write a sentence in context.
The college administrators in Exercise 1 constructed a 95% confidence interval for the slope of their regression line. Interpret the meaning of their interval (-0.332, -0.238) within the context of the problem.
A student runs an experiment to test four different popcorn brands, recording the number of kernels left un popped. She pops measured batches of each brand 4 times, using the same popcorn popper and randomizing the order of the brands. After collecting her data and analyzing the results, she
A researcher investigated four different word lists for use in hearing assessment. She wanted to know whether the lists were equally difficult to understand in the presence of a noisy background. To find out, she tested 96 subjects with normal hearing randomly assigning 24 to each of the four word
The intern from the marketing department at the Holes R Us online piercing salon (Chapter 3, Exercise 55) has recently finished a study of the company's 500 customers. He wanted to know whether people's ZIP codes vary by the last product they bought.They have 16 different products, and the ANOVA
An experiment to determine the effect of several methods of preparing cultures for use in commercial yogurt was conducted by a food science research group. Three batches of yogurt were prepared using each of three methods: traditional, ultra filtration, and reverse osmosis. A trained expert then
Particulate matter is a serious form of air pollution often arising from industrial production. One way to reduce the pollution is to put a filter, or scrubber, at the end of the smokestack to trap the particulates. An experiment to determine which smokestack scrubber design is best was run by
A student wants to investigate the effects of real vs. substitute eggs on his favorite brownie recipe. He enlists the help of 10 friends and asks them to rank each of 8 batches on a scale from 1 to 10. Four of the batches were made with real eggs, four with substitute eggs. The judges tasted the
In a statement to a Senate Public Works Committee, a senior executive of Texaco, Inc. cited a study on the effectiveness of auto filters on reducing noise. Because of concerns about performance, two types of filters were studied, a standard silencer and a new device developed by the Associated
A school district superintendent wants to test a new method of teaching arithmetic in the fourth grade at his 15 schools. He plans to select 8 students from each school to take part in the experiment, but to make sure they are roughly of the same ability; he first gives a test to all 120 students.
Fertilizers A biology student is studying the effect of 10 different fertilizers on the growth of mung bean sprouts. She sprouts 12 beans in each of 10 different petri dishes, and adds the same amount of fertilizer to each dish. After one week she measures the heights of the 120 sprouts in
We first saw data on breakfast cereals in Chapter 7. Supermarkets often place similar types of cereal on the same supermarket shelf. We have data on the shelf as well as the sugar, sodium, and calorie content of 77 cereals. Does sugar content vary by shelf? At the top of the next column is a box
A figure skater tried various approaches to her Salchow jump in a designed experiment using 5 different places for her focus (arms, free leg, midsection, takeoff leg, and free). She tried each jump 6 times in random order, using two of her skating partners to judge the jumps on a scale from 0 to 6.
We also have data on the protein content of the cereals in Exercise 19 by their shelf number. Here are the box plot and ANOVA table:a) What are the null and alternative hypotheses? b) What does the ANOVA table say about the null hypothesis? (Be sure to report this in terms of protein content and
To see how much of a difference time of day made on the speed at which he could download files, a college sophomore performed an experiment. He placed a file on a remote server and then proceeded to download it at three different time periods of the day. He downloaded the file 48 times in all, 16
A pharmaceutical company tested three formulations of a pain relief medicine for migraine headache sufferers. For the experiment, 27 volunteers were selected and 9 were randomly assigned to one of three drug formulations. The subjects were instructed to take the drug during their next migraine
A student runs an experiment to study the effect of three different mufflers on gas mileage. He devises a system so that his Jeep Wagoner uses gasoline from a one-liter container. He tests each muffler 8 times, carefully recording the number of miles he can go in his Jeep Wagoner on one liter of
A student interested in improving her dart-throwing technique designs an experiment to test 4 different stances to see whether they affect her accuracy. After warming up for several minutes, she randomizes the order of the 4 stances, throws a dart at a target using each stance, and measures the
To shorten the time it takes him to make his favorite pizza, a student designed an experiment to test the effect of sugar and milk on the activation times for baking yeast. Specifically, he tested four different recipes and measured how many seconds it took for the same amount of dough to rise to
A student performed an experiment with three different grips to see what effect it might have on the distance of a backhanded Frisbee throw. She tried it with her normal grip, with one finger out, and with the Frisbee inverted. She measured in paces how far her throw went. The box plots and the
Here are box plots, that show the relationship between the number of cylinders a car's engine has and the car's fuel economy.a) State the null and alternative hypotheses that you might consider for these data. b) Do the conditions for an ANOVA seem to be met here? Why or why not?
Here are bottle prices (in dollars) of wines produced by wineries along three of the Finger Lakes.a) What null and alternative hypotheses would you test for these data? Talk about prices and location, not symbols. b) Do the conditions for an ANOVA seem to be met here? Why or why not?
A bank is studying the time that it takes 6 of its tellers to serve an average customer. Customers line up in the queue and then go to the next available teller. Here is a box plot of the last 200 customers and the times it took each teller:a) What are the null and alternative hypotheses? b) What
Refer to the experiment in Exercise After analyzing his data the student reports that the F-ratio for Tire Pressure is 4.29 with a P-value of 0.03„, the F-ratio for Acceleration is 2.35 with a P-value of 0.143, and the F-ratio for the Interaction effect is 1.54 with a P-value of 0.241. a) What
The National Highway Transportation Safety Administration runs crash tests in which stock automobiles are crashed into a wall at 35 mph with dummies in both the passenger and the driver's seats. The THOR Alpha crash dummy is capable of recording 1 channel of data on the impact of the crash at
An experiment on mung beans was performed to investigate the environmental effects of salinity and water temperature on sprouting. Forty beans were randomly allocated to each of 36 petri dishes that were subject to one of four levels of Salinity (0, 4, 8, and 12 ppm) and one of three Temperatures
A retrospective study examined the link between baldness and the incidence of heart disease. In the study, 1435 middle-aged men were selected at random and examined to see whether they showed signs of Heart Disease (or not) and what amount of Baldness they exhibited (none, little, some, or much).A
The Chapter 3 Step-By-Step looked at a Swedish study that asked 6272 men how much fish they ate and whether or not they had prostate cancer. Here are the data:Armed with the methods of this chapter, a student performs a two-way ANOVA on the data. Here is her ANOVA table: a) Comment on her analysis.
Refer back to Exercise 13. Perform your own analysis of the data to see if baldness and heart disease are related. Do your conclusions support the claim that baldness is a cause of heart disease? Explain.In Exercise 13A student runs a two factor ANOVA on these data and finds the following ANOVA
Refer back to Exercise 14. Perform your own analysis of the data to see if eating fish and contracting prostate cancer are related.In Exercise 14
A student performed an experiment to see if her favorite sneakers and the time of day might affect her free throw percentage. She tried shooting with and without her favorite sneakers and in the early morning and at night. For each treatment combination, she shot 50 baskets on 4 different
For his final project, Jonathan examined the effects of two factors on how well stains are removed when washing clothes. On each of 16 new white handkerchiefs, he spread a teaspoon of dirty motor oil (obtained from a local garage). He chose 4 Temperature settings (each of which is a combination of
The students running the sprouts experiment (Exercise 12) also kept track of the number of beans sprouted (out of 40) for each of the 36 dishes. Here are the partial box plots of Sprouts plotted against Salinity and Temperature:An ANOVA table show: An interaction plot shows; A plot of residuals vs.
Building on the cup experiment of the Chapter 4 Step-By-Step, a student selects one type of container and designs an experiment to see whether the type of Liquid stored and the outside Environment affect the ability of a cup to maintain temperature. He randomly chooses an experimental condition and
An experiment to test a new gasoline additive, Gasplus, was performed on three different cars: a sports car, a minivan, and a hybrid. Each car was tested with both Gasplus and regular gas on 10 different occasions and their gas mileage was recorded. Here are the partial box plots:A two-way ANOVA
A gas chromatograph is an instrument that measures the amounts of various compounds contained in a sample by separating the various constituents. Because different components are flushed through the system at different rates, chromatographers are able to both measure and distinguish the various
Refer back to the experiment in Exercise 21. Instead of mpg redo the analysis using log (mpg) as the response. Do your conclusions change? How? Are the assumptions of the model better satisfied?In Exercise 21An experiment to test a new gasoline additive, Gasplus, was performed on three different
Refer back to the experiment in Exercise 22. Instead of Total counts, redo the analysis using log (Total counts) as the response. Do your conclusions change? How? Are the assumptions of the model better satisfied?In Exercise 22An experiment was performed to see whether slowing down the flow rate
A student experiment was run to test the performance of 4 brands of batteries under 2 different Environments (room temperature and cold). For each of the 8 treatments, 2 batteries of a particular brand were put into a flashlight. The flashlight was then turned on and allowed to run until the light
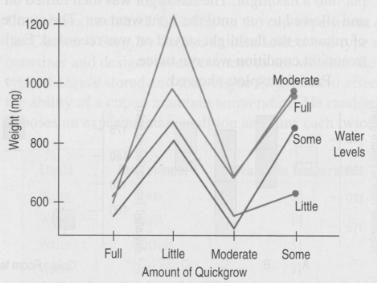
In an experiment on growing sweet peas, a team of students selected 2 factors at 4 levels each and recorded Weight, Stem Length, and Root Length after 6 \ days of growth. They grew plants using various amounts of Water and Quick grow solution, a fertilizer designed to help plants grow faster. Each
Another student analyzed the battery data from Exercise 25, using a one-way ANOVA; He considered the experimental factor to be an 8-level factor consisting of the 8 possible combinations of B and Environment. Here are the box plots for the 8 treat me and a one-way ANOVA:Compare this analysis with
Another student performs a one-way ANOVA on the container data of Exercise 20, using the 4 treatments water room, water outside, coffe room, and coffee outside. Perform this analysis and comment on the differences between this analysis and the one in Exercise 20.In Exercise 20
The TV watching study of Exercise 1 was collected as a survey of students at a small college. Do the assumptions of ANOVA appear to be met? Here are some displays to help in your decision:
The student performing the chocolate chip cookie experiment of Exercise 2 planned to analyze his results with an Analysis of Variance on two factors. Here are some displays. Do you think the Assumptions for ANOVA are satisfied?
In the previous chapter we saw a two-factor experiment to test how microwave power and temperature affect popping. She chooses 3 levels of Power (low, medium, and high) and 3 Times (3 minute 4 minutes, and 5 minutes), running one bag at each condition. She counts the number of uncooked kernels as
In Chapter 26 we saw a student experiment to study the effect of Tire Pressure and Acceleration on gas mileage. He devises a system so that his Jeep Wagoner uses gasoline from a one-liter container. He uses 3 levels of Tire Pressure (low, medium, mi full) and 2 levels of Acceleration, either
Refer to the experiment in Exercise 7. After collecting her data and analyzing the results, the student reports that the F-ratio for Power is 13.56 and F-ratio for Time is 9.36. a) What are the P-values? b) What would you conclude? c) What else about the data would you like to see in to check the
The following regression model was found for houses in an area of upstate New York: Price = 20,986.09- 7483. 10 Bedrooms + 93.84 Living Area. a) Find the predicted price of a 2 bedroom, 1000-sq-ft house from this model. b) The house just sold for $135,000. Find the residual corresponding to this
Here is another part of the regression output for the movies in Exercise 3:a) Using the values from the table, show how the value of R2 could be computed. Don't try to do the calculation, just show what is computed. b) What is the F-statistic value for this regression? c) What null hypothesis can
A regression performed to predict the selling price of houses found the equation Price = 169,328 + 35.3Area + 0.718 Lotsize - 6543Age Where Price is in dollars, Area is in square feet, Lotsize is in square feet, and Age is in years. The R2 is 92%. One of the interpretations below is correct. Which
A household appliance manufacturer wants to analyze the relationship between total sales and the company's three primary means of advertising (television, magazines, and radio). All values were in millions of dollars. They found the regression equation Sales = 250 + 6.75 TV + 3.5 Radio + 2.3
How well do exams given during the semester predict performance on the final? One class had three tests during the semester. Computer output of the regression givesa) How much of the variation in final exam scores is accounted for by the regression model? b) Explain in context what the coefficient
Hill running€”races up and down hills€”has a written history in Scotland dating back to the year 1040. Races are held throughout the year at different locations around Scotland. A recent compilation of information for 91 races (for which full information was available and
Many variables have an impact on determining the price of a house. A few of these are Size of the house (square feet), Lotsize, and number of Bathrooms. Information for a random sample of homes for sale in the Statesboro, GA, area was obtained from the Internet. Regression output modeling the
Here is the regression for the women's records for the same Scottish hill races we considered in Exercise 14:In Exercise 14a) Compare the regression model for the women's records with that found for the men's records in Exercise 14. Here's a scatter plot of the residuals for this regression: b)
Here are some diagnostic plots for the final exam data from Exercise 13. These were generated by a computer package and may look different from the plots generated by the packages you use. (In particular, note that the axes of the Normal probability plot are swapped relative to the plots we've made
Here are some diagnostic plots for the home prices data from Exercise 15. These were generated by a computer package and may look different from the plots generated by the packages you use. (In particular, note that the axes of the Normal probability plot are swapped relative to the plots we've
The AFL-CIO has undertaken a study of the yearly salaries (in thousands of dollars) of 30 administrative assistants. The organization wants to predict salaries from several other variables. The variables considered to be potential predictors of salary are:XI = months of serviceXI=years of
2. Candy sales A candy maker surveyed chocolate bars available in a local supermarket and found the following least squares regression model: Calories = 28.4 + 11.37 Fat (g) + 2.9l Sugar (g). a) The hand-crafted chocolate she makes has 15g of fat and 20g of sugar. How many calories does the model
Showing 55800 - 55900
of 88243
First
552
553
554
555
556
557
558
559
560
561
562
563
564
565
566
Last
Step by Step Answers
.png)
.png)
.png)
.png)
.png)
-1.png)
-2.png)
-3.png)
.png)
.png)
.png)
-1.png)
-2.png)
-3.png)
-1.png)
-2.png)
-3.png)
.png)
.png)
.png)
.png)
.png)
.png)
-1.png)
-2.png)
-1.png)
-2.png)
-3.png)
-1.png)
-2.png)
-3.png)
-1.png)
-2.png)
-1.png)
-2.png)
.png)
.png)
.png)
-1.png)
-2.png)
-3.png)
.png)
.png)
.png)
-1.png)
-2.png)
-3.png)
-1.png)
-2.png)
-3.png)
.png)
-1.png)
-2.png)
-3.png)
-1.png)
-2.png)
-3.png)
-1.png)
-2.png)
-3.png)
-1.png)
-2.png)
-3.png)
.png)
-1.png)
-2.png)
.png)
.png)
-1.png)
-2.png)
-1.png)
-2.png)
-1.png)
-2.png)
-1.png)
-2.png)
-1.png)
-2.png)
-3.png)
-1.png)
-2.png)
-3.png)
.png)
.png)
-1.png)
-2.png)
-1.png)
-2.png)
.png)
.png)
-1.png)
-2.png)
-1.png)
-2.png)
-3.png)
-1.png)
-2.png)
-3.png)
-1.png)
-2.png)
-1.png)
-2.png)
-1.png)
-2.png)
-1.png)
-2.png)
.png)
-1.png)
-2.png)
-1.png)
-2.png)
-3.png)
-1.png)
-2.png)
-3.png)
-1.png)
-2.png)
-3.png)
-1.png)
-2.png)
-3.png)
-1.png)
-2.png)
-3.png)
-1.png)
-2.png)
-3.png)
-1.png)
-2.png)
-3.png)
-1.png)
-2.png)
.png)
.png)
-1.png)
-2.png)
-3.png)
.png)
-1.png)
-2.png)
.png)
.png)
.png)
-1.png)
-2.png)
-3.png)
-1.png)
-2.png)
-3.png)
.png)

