New Semester
Started
Get
50% OFF
Study Help!
--h --m --s
Claim Now
Question Answers
Textbooks
Find textbooks, questions and answers
Oops, something went wrong!
Change your search query and then try again
S
Books
FREE
Study Help
Expert Questions
Accounting
General Management
Mathematics
Finance
Organizational Behaviour
Law
Physics
Operating System
Management Leadership
Sociology
Programming
Marketing
Database
Computer Network
Economics
Textbooks Solutions
Accounting
Managerial Accounting
Management Leadership
Cost Accounting
Statistics
Business Law
Corporate Finance
Finance
Economics
Auditing
Tutors
Online Tutors
Find a Tutor
Hire a Tutor
Become a Tutor
AI Tutor
AI Study Planner
NEW
Sell Books
Search
Search
Sign In
Register
study help
mathematics
statistics
Business Statistics Communicating With Numbers 2nd Edition Sanjiv Jaggia, Alison Kelly - Solutions
An environmentalist wants to examine whether average fuel consumption (measured in miles per gallon) is affected by fuel type (factor A) and type of hybrid (factor B). A two-way ANOVA experiment with interaction is performed. The results are shown in the accompanying tablea. Use Excel to generate
A management consultant wants to determine whether the age and gender of a restaurant's wait staff influence the size of the tip the customer leaves. Three age brackets (factor A in columns: young, middle-age, older) and gender (factor B in rows: male, female) are used to construct a two way ANOVA
A production manager is investigating whether the operator training method (factor A) will affect the resulting output for a particular product. Three training methods were studied: a full-day workshop (most intensive), in-line training, and as-needed training (least intensive). Since the value of
The cutting department at Best Cuts, a furniture manufacturer, is examining the effect of depth of cut and feed rate on the surface roughness of table legs used in a popular dining room table model. The accompanying table shows the surface roughness results for six replicates involving three
Lisa Grattan, a financial analyst for a small investment firm, collects annual stock return data for 10 firms in the energy industry, 13 firms in the retail industry, and 16 firms in the utilities industry. A portion of the data is shown in the accompanying
In 2007, the United States experienced the biggest jump in food prices in 17 years (The Wall Street Journal, April 1, 2008). A variety of reasons led to this result, including rising demand for meat and dairy products in emerging overseas markets, increased use of grains for alternative fuels, and
The manager of an SAT review program wonders whether the ethnic background of a student and the program's instructor affect the student's performance on the SAT. Four ethnicities and three instructors are examined. Ten student scores for each combination are sampled. A portion of the data is shown
Consider the following sample data:a. Construct and interpret a scatter plot.b. Calculate and interpret the sample covariance.c. Calculate and interpret the sample correlation coefficient.
Many attempts have been made to relate happiness with various factors. One such study relates happiness with age and finds that holding everything else constant, people are least happy when they are in their mid-40s (The Economist, December 16, 2010). The accompanying table shows a portion of data
The following table lists the National Basketball Association's leading scorers, their average points per game (PPG), and their average minutes per game (MPG) for 2008.a. Calculate and interpret the sample correlation coefficient between PPG and MPG.b. Specify the competing hypotheses in order to
Consider the following sample data:a. Construct and interpret a scatter plot.b. Calculate and interpret sxy.c. Calculate and interpret rxy.
Refer to the accompanying data file on happiness and age to answer the following questions. a. Use Excel to estimate a simple linear regression model with Happiness as the response variable and Age as the explanatory variable. b. Use the sample regression equation to predict Happiness when Age
A horticulturist is studying the relationship between tomato plant height and fertilizer amount. Thirty tomato plants grown in similar conditions were subjected to various amounts of fertilizer over a four-month period, and then their heights were measured. A portion of the data is shown in the
Consider the following competing hypotheses:H0: ρxy = 0HA: ρxy ≠ 0The sample consists of 25 observations and the sample correlation coefficient is 0.15.a. At the 5% significance level, specify the critical value(s) and the decision rule.b. Calculate the value of the test statistic.c. What is
Finger dexterity, the ability to make precisely coordinated finger movements to grasp or assemble very small objects, is important in jewelry making. Subsequently, the manufacturing manager at Gemco, a manufacturer of high-quality watches, wants to develop a regression model to predict the
Consider the following sample data:a. Estimate a multiple linear regression model and interpret its coefficients.b. Find the predicted value for y if x1 equals 50 and x2 equals 20.
Consider the following competing hypotheses: H0: ρxy ≥ 0 HA: ρxy < 0 The sample consists of 30 observations and the sample correlation coefficient is -0.60. a. Calculate the value of the test statistic. b. Approximate the p-value. c. At the 5% significance level, what is the conclusion to the
The maintenance manager at a trucking company wants to build a regression model to forecast the time until the first engine overhaul based on four independent variables: (1) annual miles driven, (2) average load weight, (3) average driving speed, (4) oil change interval. Based on driver logs and
The facility manager at a pharmaceutical company wants to build a regression model to forecast monthly electricity cost. Three main variables are thought to dictate electricity cost: (1) average outdoor temperature, (2) working days per month, (3) tons of product produced. A portion of the past
A sample of 10 observations provides the following statistics: sx = 13, sy = 18, and sxy = 117.22 a. Calculate and interpret the sample correlation coefficient rxy. b. Specify the hypotheses to determine whether the population correlation coefficient is positive. c. Calculate the value of the test
A sample of 25 observations provides the following statistics: sx = 2, sy = 5, and sxy = -1.75 a. Calculate and interpret the sample correlation coefficient rxy. b. Specify the competing hypotheses in order to determine whether the population correlation coefficient differs from zero. c. Make a
The accompanying data file shows the midterm and final scores for 32 students in a statistics course.a. Estimate a student's final score as a function of his/ her midterm score.b. Find the standard error of the estimate.c. Find and interpret the coefficient of determination.
The accompanying data file shows the square footage and associated property taxes for 20 homes in an affluent suburb 30 miles outside New York City.a. Estimate a home's property taxes as a linear function of the size of the home (measured by its square footage).b. What proportion of the sample
The following table shows the annual returns for two of Vanguard's mutual funds: the Vanguard Energy Fund and the Vanguard Healthcare Fund.a. Calculate and interpret the sample correlation coefficient rxy. b. Specify the competing hypotheses in order to determine whether the population correlation
In response to the Great Recession, Federal Reserve leaders continue to keep the short run target interest rate near zero. While the Fed controls short-term interest rates, long-term interest rates essentially depend on supply/demand dynamics, as well as longer-term interest rate expectations.
In June 2009, an onslaught of miserable weather in New England played havoc with people's plans and psyches. However, the dreary weather brought a quiet benefit to many city neighborhoods. Police reported that the weather was a key factor in reducing fatal and non-deadly shootings (The Boston
Diversification is considered important in finance because it allows investors to reduce risk by investing in a variety of assets. It is especially effective when the correlation between the assets is low. Consider the accompanying table, which shows a portion of monthly data on closing stock
A realtor studies the relationship between the size of a house (in square feet) and the property taxes owed by the owner. He collects the following data on six homes in an affluent suburb 60 miles outside of New York City.________________Square FeetProperty Taxes ($)Home
A local university offers its employees the following Fidelity investment products for their retirement plans:• Fidelity Total Bond Fund• Fidelity Short-Term Bond Fund• Fidelity Magellan Fund• Fidelity International Small Cap Fund• Fidelity Freedom Income FundAfter working at the
The accompanying data file shows midterm and final grades for 32 students. Estimate a student's final grade as a linear function of a student's midterm grade. At the 1% significance level, is a student's midterm grade significant in explaining a student's final grade? Show the relevant steps of the
The accompanying data file shows the square footage and associated property taxes for 20 homes in an affluent suburb 30 miles outside of New York City. Estimate a home's property taxes as a linear function of its size. At the 5% significance level, do home size and property taxes have a linear
A horticulturist is studying the relationship between tomato plant height and fertilizer amount. Thirty tomato plants grown in similar conditions were subjected to various amounts of fertilizer over a four-month period, and then their heights were measured. a. Estimate the regression model: Height
Finger dexterity, the ability to make precisely coordinated finger movements to grasp or assemble very small objects, is important in jewelry making. Thus, the manufacturing manager at Gemco, a manufacturer of high-quality watches, wants to develop a regression model to predict the productivity (in
The maintenance manager at a trucking company wants to build a regression model to forecast the time until the first engine overhaul based on four explanatory variables: (1) annual miles driven, (2) average load weight, (3) average driving speed, and (4) oil change interval. Based on driver logs
The facility manager at a pharmaceutical company wants to build a regression model to forecast monthly electricity cost. Three main variables are thought to dictate electricity cost: (1) average outdoor temperature, (2) working days per month, and (3) tons of products produced.a. Estimate the
Consider a portion of simple linear regression results,y = 105.40 + 39.17x1; SSE = 407,308; n = 30In an attempt to improve the results, two explanatory variables are added. The relevant regression results are the following:y = 4.87 + 19.47x1 - 26.31x2 + 7.31x3;SSE = 344,784; n = 30a. Formulate the
A real estate analyst estimates the following regression, relating a house price to its square footage (Sqft):In an attempt to improve the results, he adds two more explanatory variables: the number of bedrooms (Beds) and the number of bathrooms (Baths). The estimated regression equation is SSE =
A financial analyst believes that the best way to predict a firm’s returns is by using the firm’s price-to-earnings ratio (P∕E) and its price-to sales ratio (P∕S) as explanatory variables. He estimates the following regression, using 30 large firms:SSE = 5,021.63; n = 30A colleague suggests
Lisa Fisher is a business school professor who would like to analyze university factors that enhance innovation. She collects data on 143 universities in 2008 for a regression where the response variable is the number of startups (Startups), which is used as a measure for innovation. Lisa believes
A researcher interviews 50 employees of a large manufacturer and collects data on each worker's hourly wage (Wage), years of higher education (EDUC), experience (EXPER), and age (AGE). A portion of the data is shown in the accompanying table.Wage EDUC EXPER
The manager of a local Costo store is in the process of making hiring decisions for selling mobile phone contracts. She believes that the sale of mobile phone contracts depends crucially on the number of hours clocked by male and female employees. She collects the weekly data on last year's sales
A multiple regression model is used to predict an NFL team's winning record (Win). For the explanatory variables, the average rushing yards (Rush) and the average passing yards (Pass) are used to capture offense and the average yards allowed are used to capture defense. A portion of the data for
An automotive workers union, in conjunction with top management, is negotiating a new hourly pay policy for union workers based on three variables: (1) job class, (2) years with the company, and (3) years as a union member at any company. The goal is to develop an equitable model that can
Consider the following sample data:a. Find the sample regression line, y = b0 + b1x.b. Construct the 95% confidence interval for E(y) if x = 15.c. Construct the 95% prediction interval for y if x = 15.
Consider the following sample data:a. Find the sample regression equation, y = b0 + b1x1 + b2x2.b. Construct the 95% confidence interval for E(y) if x1 equals 50 and x2 equals 20.c. Construct the 95% prediction interval for y if x1 equals 50 and x2 equals 20.
A horticulturist is studying the relationship between tomato plant height and fertilizer amount. He uses a sample of 30 to estimate the regression model as Height = β0 + β1Fertilizer + ε. a. Estimate the regression model to predict the height of a tomato plant that received 3.0 ounces of
Estimate: Debt = β0 + β1Income + ε, where Debt is the average debt payments for a household in a particular city (in $) and Income is the city's median income (in $1,000s).a. Construct the 95% confidence interval for expected debt payments if income is $80,000.b. Construct the 95% prediction
Estimate: Price = β0 + β1Sqft + β2Beds + β2Baths + ε, where Price, Sqft, Beds, and Baths refer to home price, square footage, number of bedrooms, and number of bathrooms, respectively. Construct the 95% confidence interval for the expected price of a 2,500-square-foot home in Arlington,
The maintenance manager at a trucking company wants to build a regression model to forecast the time until the first engine overhaul based on four explanatory variables: (1) annual miles driven, (2) average load weight, (3) average driving speed, and (4) oil change interval. Based on driver logs
Consider the data on salary (in $) and work experience (in years) of 100 employees in a marketing firm. Estimate the model y = β0 + β1 x + ε, where y is salary and x is work experience. a. Explain why you would be concerned about changing variability in this application. b. Use a residual plot
Quick2U, a delivery company, would like to standardize its delivery charge model for shipments such that customers will better understand their delivery costs. Three variables are used: (1) distance (one-way), (2) shipment weight, and (3) number of boxes. A sample of 30 recent deliveries is
The consumption function is one of the key relationships in economics; where consumption y depends on disposable income x. consider the quarterly data for these seasonally adjusted variables, measured in billions of dollars. A portion of the data is shown in the accompanying
The marketing manager at Turfco, a lawn mower company, believes that monthly sales across all outlets (stores, online, etc.) are influenced by three key variables: (1) outdoor temperature, (2) advertising expenditures, and (3) promotional discounts. A portion of the monthly sales data for the past
The labor estimation group at Sturdy Electronics, a contract electronics manufacturer of printed circuit boards, wants to simplify the process it uses to quote production costs to potential customers. They have identified the primary drivers for production time (and thus production cost) as being
The homeownership rate in the U.S. was 67.4% in 2009. In order to determine if homeownership is linked with income, 2009 state level data on the homeownership rate (Ownership) and median household income (Income) were collected. A portion of the data is shown in the accompanying table.State
Consider the following two estimated models:Ŷ = 25 + 1.2xŶ = 30 + 1.4x – 0.12x2For each of the estimated models, predict y when x equals 5 and 10.
A lead inspector at Electro Tech, an electronics assembly shop, wants to convince management that it takes longer, on a per-component basis, to inspect large devices with many components than it does to inspect small devices because it is difficult to keep track of which components have already
You collect data on 26 metropolitan areas to analyze average monthly debt payments in terms of income and the unemployment rate. A portion of the data is shown in the accompanying table.a. Estimate the model Debt = β0 + β1Inc + β2Unemp + ε. Is unemployment significant at the 5% level?b.
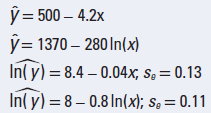
Consider the following four estimated models:a. Interpret the slope coefficient in each of these estimated models.b. For each model, what is the predicted change in y when x increases by 1%, from 100 to 101?
Consider the following estimated models:a. Interpret the slope coefficient in each of these estimated models.b. For each model, what is the predicted change in y when x increases by 5%, from 10 to 10.5?
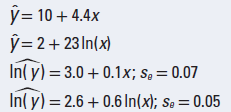
Consider the sample regressions for the linear, the logarithmic, the exponential, and the log-log models. For each of the estimated models, predict y when x equals 100.
Consider the sample regressions for the linear, the logarithmic, the exponential, and the log-log models. For each of the estimated models, predict y when x equals 50.
Consider the following 10 observations of y and x.a. Plot the accompanying data to choose between the linear and logarithmic models.b. Justify your choice using the appropriate numerical measure.c. Use the selected model to predict y for x = 10.
Consider the following 10 observations of y and x.a. Plot the above data to choose between the linear and the exponential model.b. Justify your choice using R2 defined in terms of y.c. With the best-fitting model, predict y for x = 20.
An economist is interested in examining how an individual's cigarette consumption (C) may be influenced by the price for a pack of cigarettes (P) and the individual's annual income (I). Using data from50 individuals, she estimates a log-log model and obtains the following regression
According to the World Health Organization, obesity has reached epidemic proportions globally.While obesity has generally been linked with chronic disease and disability, researchers argue that it may also affect wages. Body Mass Index (BMI) is a widely used weight measure that also adjusts for
Consider the following three models:For each of the estimated models, predict y when x equals 10 and 15.
A manufacturing manager uses a dexterity test on 20 current employees in order to predict watch production based on time to completion (in seconds). A portion of the data is shown below.Time (seconds)......................Watches per
Professor Orley Ashenfelter of Princeton University is a pioneer in the field of wine economics. He claims that, contrary to old orthodoxy, the quality of wine can be explained mostly in terms of weather conditions. Wine romantics accuse him of undermining the whole wine-tasting culture. In an
The facility manager at a pharmaceutical company wants to build a regression model to forecast monthly electricity cost (Cost). Three main variables are thought to influence electricity cost:(1) Average outdoor temperature (Temp),(2) Working days per month (Days), and(3) Tons of product produced
Chad Dobson has heard about the positive outlook for real estate investment in college towns. He is interested in investing in Davis, California, which houses one of the University of California campuses. He uses zillow.com to access data on 2011 monthly rents for 27 houses, along with three
Life expectancy at birth is the average number of years that a person is expected to live. There is a huge variation in life expectancies between countries, with the highest being in Japan, and the lowest in some African countries. An important factor for such variability is the availability of
Use the data in Exercise 24 to answer the same four questions regarding life expectancy of males. Who is more likely to benefit from adding more physicians to the population? Explain.
Economists often examine the relationship between the inputs of a production function and the resulting output. A common way of modeling this relationship is referred to as the Cobb-Douglas production function. This function can be expressed as ln(Q) = β0 + β1 ln(L) + β2 ln (K ) + ε,
A sports enthusiast wants to examine the factors that influence a quarterback's salary (Salary). In particular, he wants to assess the influence of the pass completion rate (PC), the total touchdowns scored (TD), and a quarterback's age (Age) on Salary. He uses 2009 data, a portion of which is
A horticulturist is studying the relationship between tomato plant height and fertilizer amount. Thirty tomato plants grown in similar conditions were subjected to various amounts of fertilizer over a four-month period, and then their heights were measured. A portion of the results is shown in the
The operators manager at an electronics company believes that the time required for workers to build a circuit board is not necessarily proportional to the number of parts on the board. He wants to develop a regression model to predict time based on part quantity. He has collected data for the last
Consider the following 10 observations on the response variable y and the explanatory variable x.a. Plot the above data and then estimate the linear and the quadratic regression models.b. Use the appropriate numerical measure to justify which model fits the data best.c. Given the best-fitting
The operators manager at an electronics company believes that the time required for workers to build a circuit board is not necessarily proportional to the number of parts on the board. He wants to develop a regression model to predict time based on part quantity. He has collected data for the last
A nutritionist wants to understand the influence of income and healthy food on the incidence of smoking. He collects 2009 data on the percentage of smokers in each state in the U.S. and the corresponding median income and the percentage of the population that regularly eats fruits and vegetables. A
The accompanying table shows a portion of the monthly data on the personal savings rate (Savings) and personal disposable income (Income) in the U.S. from January 2007 to November 2010.a. Compare the linear model, Savings = β0 + β1 Income + ε, with a log-log model, ln (Savings) = β0 +
The inventory manager at a warehouse distributor wants to predict inventory cost based on order quantity. She thinks it may be a nonlinear relationship since its two primary components move in opposite directions: (1) order processing cost (costs of procurement personnel, shipping, transportation),
Learning curves are used in production operations to estimate the time required to complete a repetitive task as an operator gains experience. Suppose a production manager has compiled 30 time values for a particular operator as she progressed down the learning curve during the first 100 units. A
Consider the following 10 observations on the response variable y and the explanatory variable x.a. Plot the above data and estimate the linear and the quadratic regression models.b. Use the appropriate numerical measure to justify which model fits the data best.c. Given the best-fitting model,
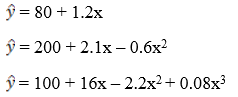
Consider the following sample regressions for the linear, the quadratic, and the cubic models along with their respective R2 and adjusted R2.a. Predict y for x = 1 and 2 with each of the estimated models.b. Select the most appropriate model. Explain.
Consider the following sample regressions for the linear, the quadratic, and the cubic models along with their respective R2 and adjusted R2.a. Predict y for x = 2 and 3 with each of the estimated models.b. Select the most appropriate model. Explain.
Numerous studies have shown that watching too much television hurts school grades. Others have argued that television is not necessarily a bad thing for children (Mail Online, July 18, 2009). Like books and stories, television not only entertains, it also exposes a child to new information about
The project manager at a construction company is evaluating how crew size affects the productivity of framing jobs. He has experimented with varying crew size on a weekly basis over the past 27 weeks and has recorded weekly productivity (in jobs completed). A portion of the data is shown in the
Consider a sample comprised of firms that were targets of tender offers during the period 1978-1985. Conduct an analysis where the response variable represents the number of bids (Bids) received prior to the takeover of the firm. The explanatory variables include the bid premium (Premium) and firm
Executive compensation has risen dramatically beyond the rising levels of an average worker's wage over the years. This has been a hot topic for discussion, especially with the crisis in the financial sector and the controversy over the federal bailout. The government is even considering a cap on
A British survey just revealed that the New York Yankees baseball team pays their players, on average, more than any other team in the world (sportsillustrated.cnn.com, April 7, 2010). Brendan Connolly, a statistician for a Major League Baseball (MLB) team, wants to elaborate on the salary of
According to a recent report by the government, new home construction fell to an 18-month low in October, 2010 (CNNMoney.com, November 17, 2010). Housing starts, or the number of new homes being built, experienced an 11.7% drop in the seasonally adjusted annual rate. Beena Singh works for a
A government researcher is analyzing the relationship between retail sales and the gross national product (GNP). He also wonders whether there are significant differences in retail sales related to the quarters of the year. He collects 10 years of quarterly data. A portion is shown in the
The general manager of QuickFix, a chain of quick-service, no-appointment auto repair shops, wants to develop a model to forecast monthly vehicles served at any particular shop based on four factors: garage bays, population within 5-mile radius, interstate highway access (1 = convenient access, 0 =
Consider a linear regression model where y represents the response variable and x and d are the explanatory variables; d is a dummy variable assuming values 0 or 1. A model with the dummy variable d and the interaction variable xd is estimated as Ŷ = 5.2 + 0.9x + 1.4d + 0.2xd.a. Compute Ŷ for x
Using 20 observations, the following regression output is obtained from estimating y = β0 + β1x + β2d + β3xd + ɛ.a. Compute Ŷ for x = 10 and d = 1; then compute Ŷ for x = 10 and d = 0.b. Are the dummy variable d and the interaction variable xd individually significant at the
The annual salary of an employee y (in thousands of dollars) is estimated as a function of years of experience x ; a dummy variable d that equals 1 for college graduates and 0 for those graduating high school but not college; and a product of this dummy variable and experience, xd. The estimated
The distribution center for an online retailer has been experiencing quite a few "pick errors" (i.e., retrieving the wrong item). Although the warehouse manager thinks most errors are due to inexperienced workers, she believes that a training program also may help to reduce them. Before sending all
One of the theories regarding initial public offering (IPO) pricing is that the initial return (change from offer to open price) on an IPO depends on the price revision (change from pre-offer to offer price). Another factor that may influence the initial return is a high-tech dummy that equals 1
The following table shows a portion of monthly data on the personal savings rate (Savings) and the personal disposable income (Income) in the U.S. from January 2007 to November 2010.Date.................... Savings (%).................... Income ($ billions)2007-01.........................
Showing 73100 - 73200
of 88243
First
725
726
727
728
729
730
731
732
733
734
735
736
737
738
739
Last
Step by Step Answers
.png)
.png)
.png)
.png)
.png)
.png)
.png)
.png)
.png)
.png)
.png)
.png)
.png)
.png)
.png)
.png)
.png)
.png)
.png)
.png)
.png)
.png)
.png)
.png)
.png)
.png)
.png)
.png)
.png)
.png)
.png)
.png)
.png)
.png)
.png)
.png)
.png)

