

Question: Purchasing Department cost drivers, multiple regression analysis Barry Lee decides that the simple regression analysis used in Problem 10-40 could be extended to a multiple
Purchasing Department cost drivers, multiple regression analysis Barry Lee decides that the simple regression analysis used in Problem 10-40 could be extended to a multiple regression analysis. He finds the following results for two multiple regression analyses:
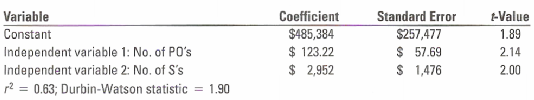
Regression 4: PDC = a + (b1 × No. of P0’s) + (b2 × No. of S’s)
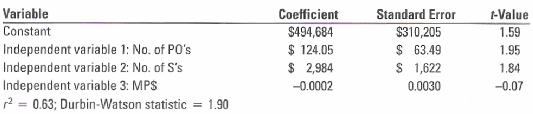
Regression 5: PDC = a + (b1 × No. of P0’s) + (b2 × No. of S’s) + (b3 × MP$)
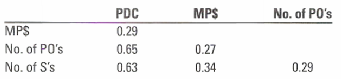
The coefficients of correlation between combinations of pairs of the variables are:
1. Evaluate regression 4 using the criteria of economic plausibility, goodness of fit, significance of independent variables and specification analysis. Compare regression 4 with regressions 2 and 3 in Problem 10-40. Which one of these models would you recommend that Lee use? Why?
2. Compare regression 5 with regression 4. Which one of these models would you recommend that Lee use? Why?
3. Lee estimates the following data for the Baltimore store for next year: dollar value of merchandise purchased, $75,000,000; number of purchase orders, 3,900; number of suppliers, 110. How much should Lee budget for Purchasing Department costs for the Baltimore store for next year?
4. What difficulties do not arise in simple regression analysis that may arise in multiple regression analysis? Is there evidence of such difficulties in either of the multiple regressions presented in this problem? Explain.
5. Give two examples of decisions in which the regression results reported here (and in Problem 10-40) could be informative.
Standard Error $257,477 $ 57.69 $ 1,476 Variable Coefficient $485,384 $ 123.22 -Value 1.89 2.14 2.00 Constant Independent variable 1: No. of PO's Independent variable 2: No. of S's p? = 0.63; Durbin-Watson statistic $ 2,952 1.90
Step by Step Solution
3.38 Rating (176 Votes )
There are 3 Steps involved in it
Purchasing Department cost drivers multiple regression analysis The problem reports the exact tvalues from the computer runs of the data Because the coefficients and standard errors given in the probl... View full answer

Get step-by-step solutions from verified subject matter experts
Document Format (1 attachment)
24-B-C-A-C-B-M (56).docx
120 KBs Word File